


 Ultra abonnement.

Executive Summary
Live streaming stabilized in Q2 2026, with 21.5 billion hours watched across tracked platforms. That was essentially flat quarter over quarter (+0.1%) but still up 7.6% year over year. The bigger story was the shift between platforms: YouTube Gaming declined year over year, Twitch’s slide continued to ease, Kick kept growing, and Facebook Gaming fell further.

Key takeaways
- Industry growth stalled quarter over quarter, but remained healthy year over year. Total hours watched reached 21.5 billion, up just 0.1% from Q1 but 7.6% from Q2 2025, as YouTube Live growth offset weakness elsewhere.
- YouTube Gaming reversed course. Hours watched fell 19.3% quarter over quarter and 18.9% year over year to 1.79 billion, its first annual decline in more than a year. Unique channels also dropped 28.2%, the steepest decline among major platforms.
- Twitch showed further signs of stabilization. Hours watched dipped just 0.7% quarter over quarter, while the year-over-year decline improved to 8.3% from 13.7% in Q1. Just Chatting remained its top category at 670.5 million hours watched.
- Kick remained the fastest-growing major platform, despite slowing momentum. Hours watched rose 5.5% quarter over quarter and 36.7% year over year to 1.34 billion, though annual growth slowed from 65.3% in Q1.
- Facebook Gaming’s decline accelerated. Hours watched fell 45.5% quarter over quarter and 64.8% year over year to 14.8 million, leaving the platform with roughly 0.1% of total industry watch time.
- YouTube Live extended its lead. Hours watched rose 2.7% quarter over quarter and 18.0% year over year to 12.97 billion, increasing its share of total watch time to 60.3% from 58.8% in Q1.
- League of Legends dominated the esports conversation. It was the most-watched game on Chzzk and Afreeca, while League events accounted for all three of the quarter’s biggest esports draws: LCK, MSI, and LEC Spring. Just Chatting remained the top category on Twitch, Kick, and
Platform performance
This section compares Q2 2026 performance across major live-streaming platforms, including hours watched, hours streamed, unique channels, and average concurrent viewership (ACV) against both the prior quarter (QoQ, vs. Q1 2026) and the same quarter a year ago (YoY, vs. Q2 2025).
Market share
A note on scope: This is the first report to include YouTube Live alongside YouTube Gaming. As IRL talk and variety content account for an increasing share of live-streaming viewership, tracking only gaming content no longer accurately reflects how audiences spend their time. Historical YouTube Live data has been added throughout the report to ensure consistent comparisons.
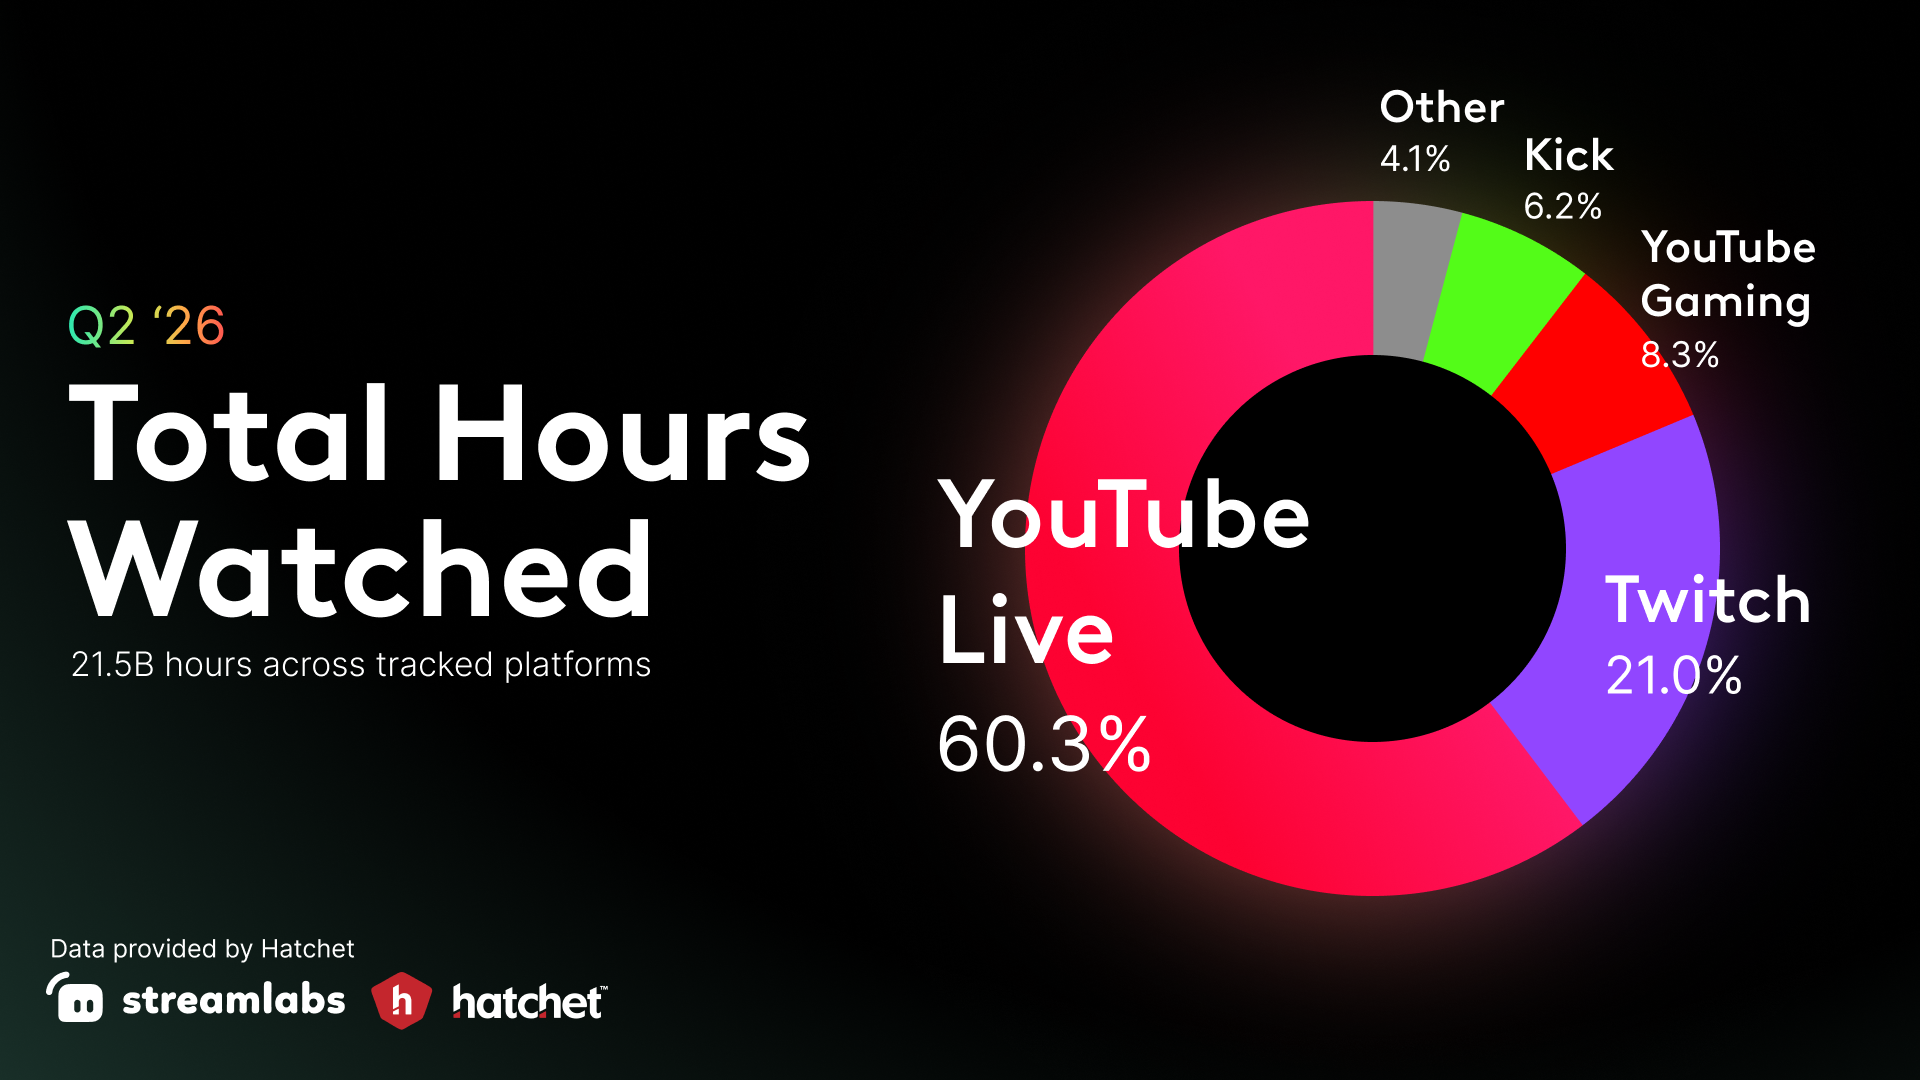
YouTube Live extended its lead in Q2 2026, accounting for 60.3% of total hours watched, up from 58.8% in Q1. Twitch followed at 21.0%, YouTube Gaming at 8.3%, and Kick at 6.3%. All other tracked platforms combined accounted for roughly 4.1%
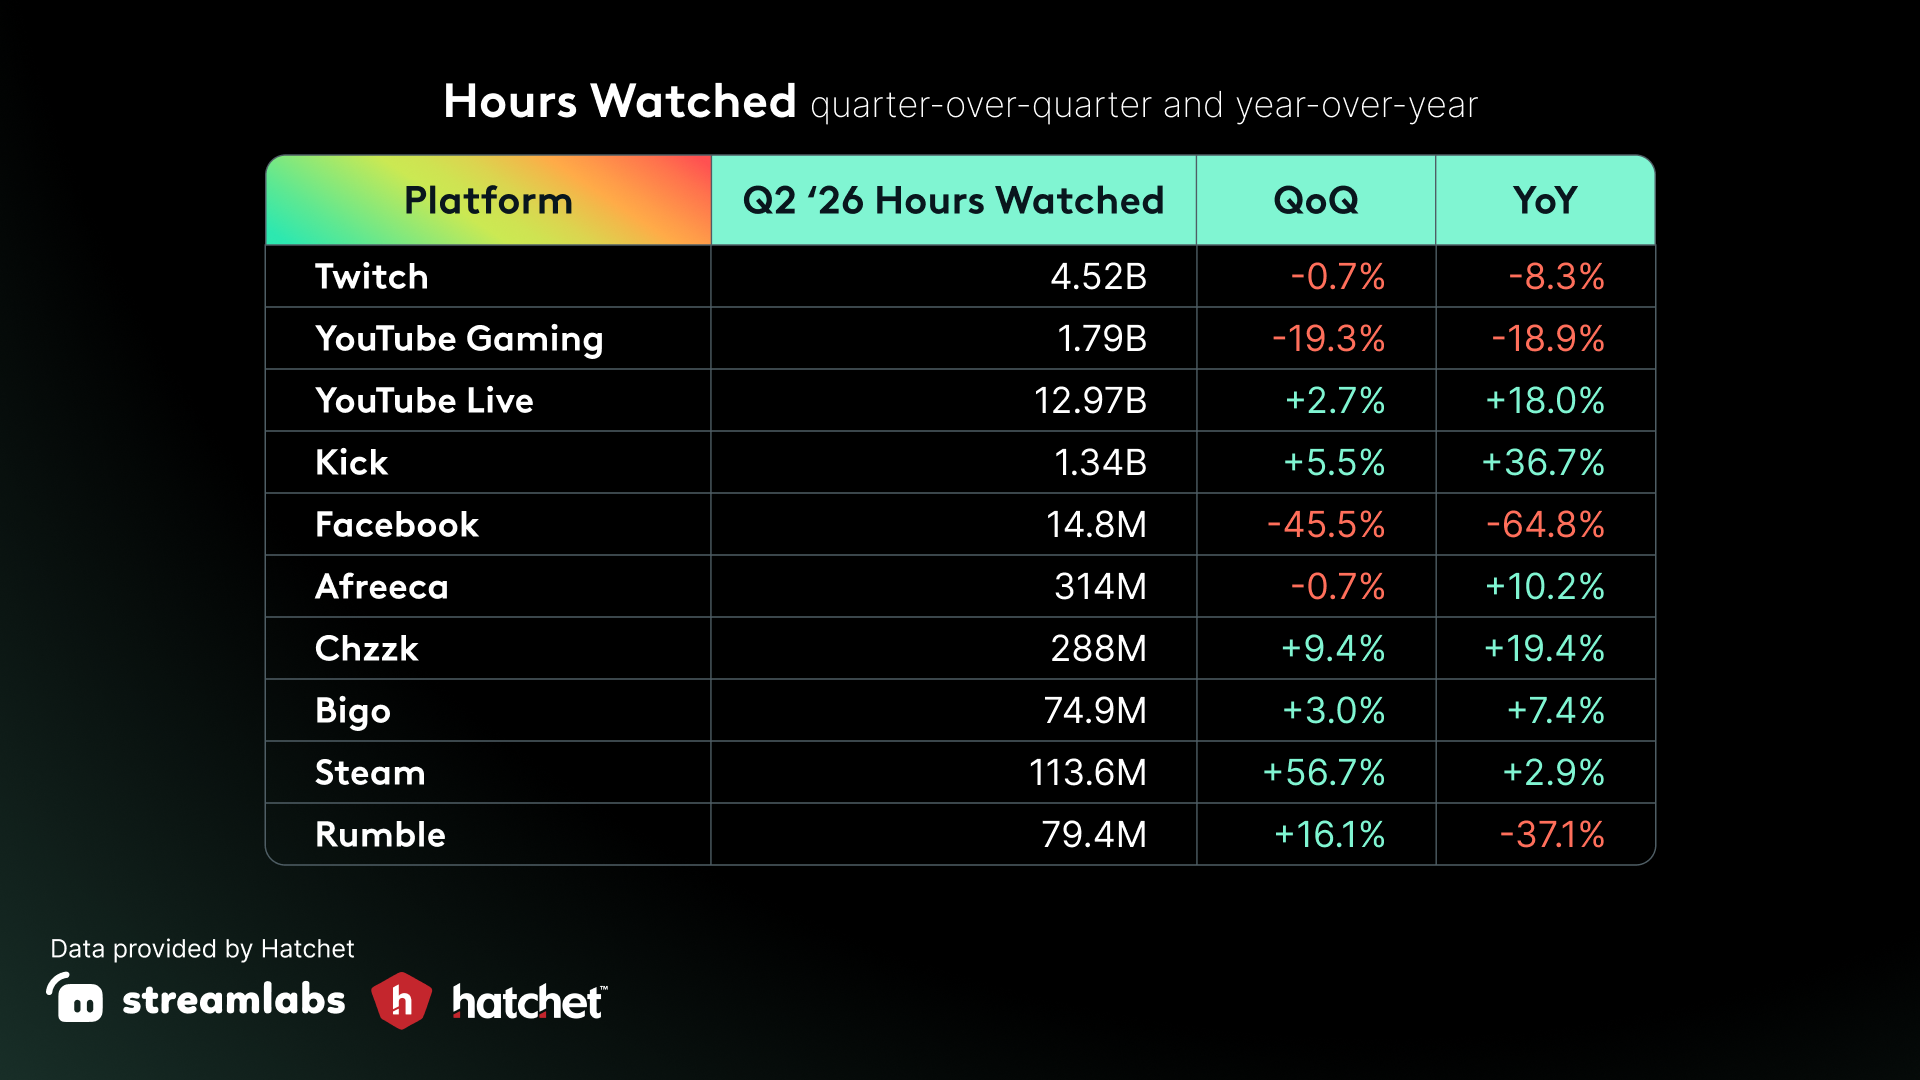
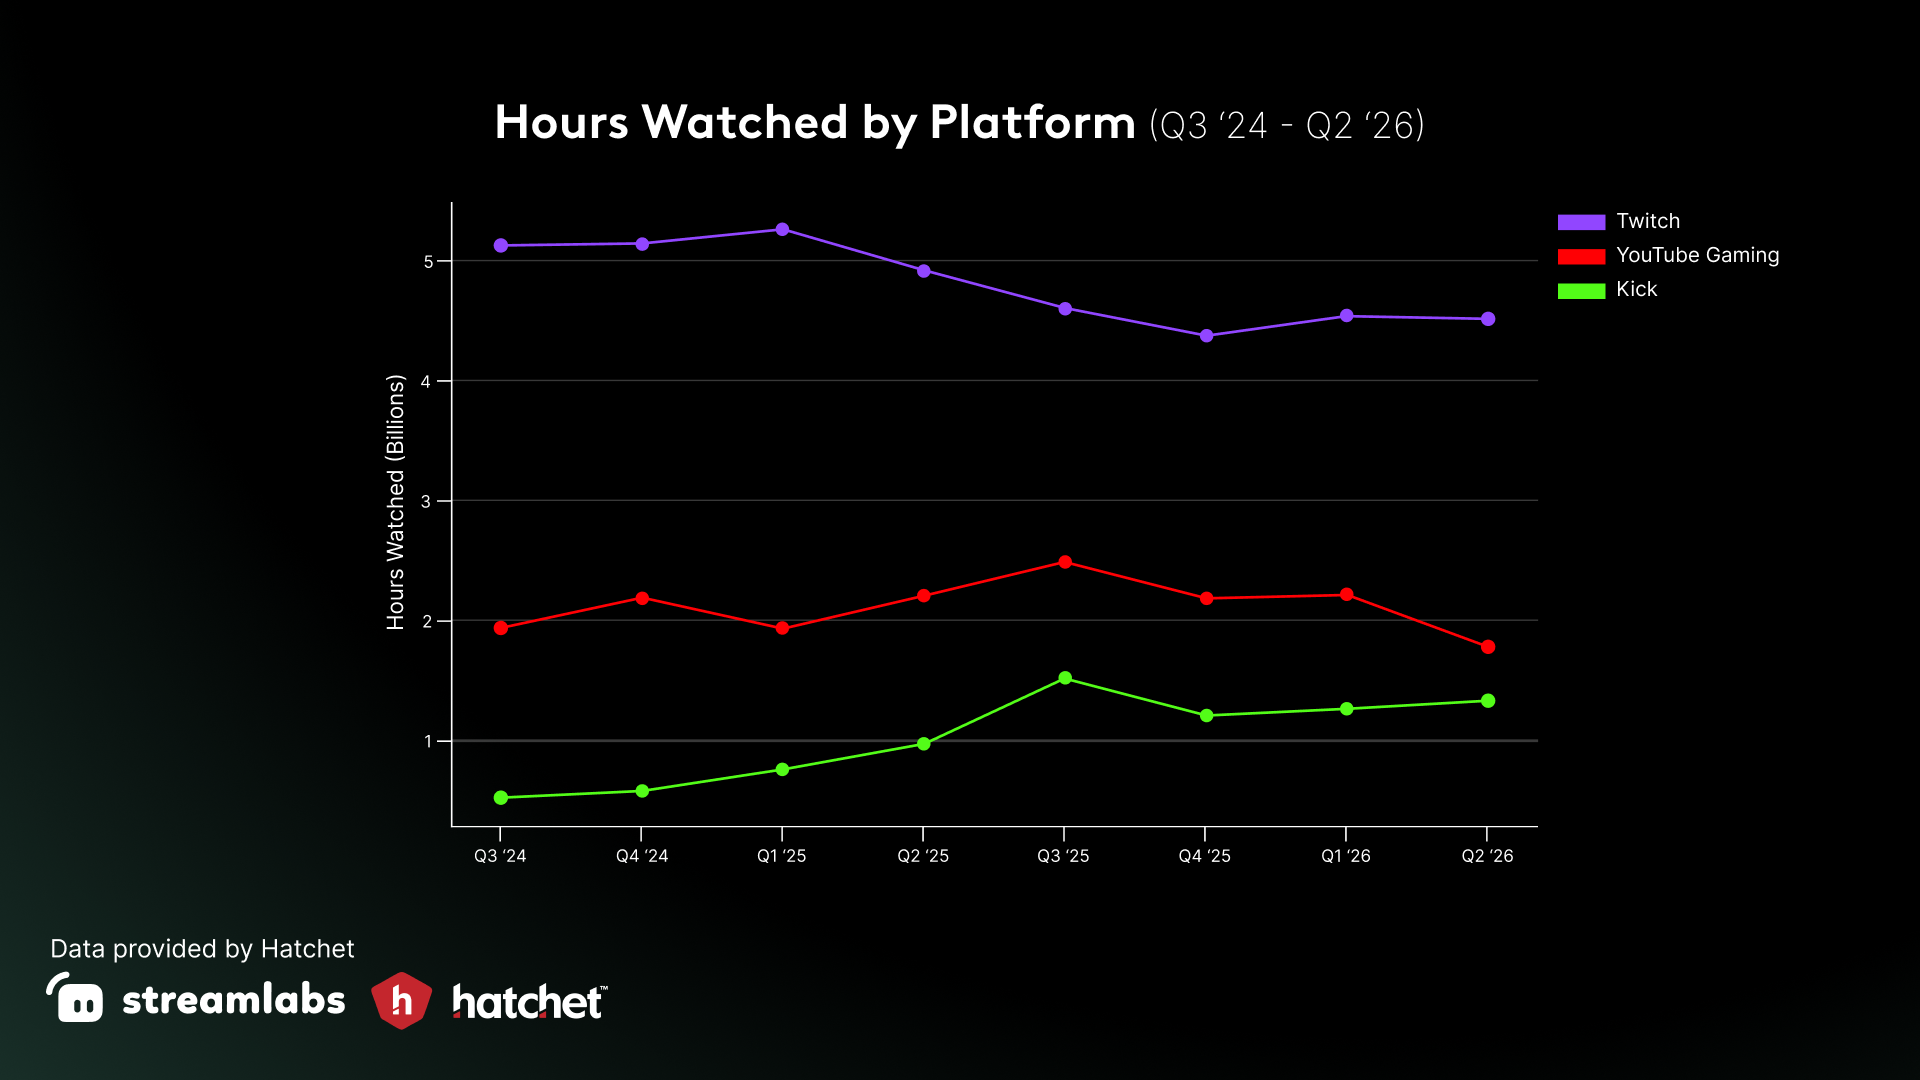
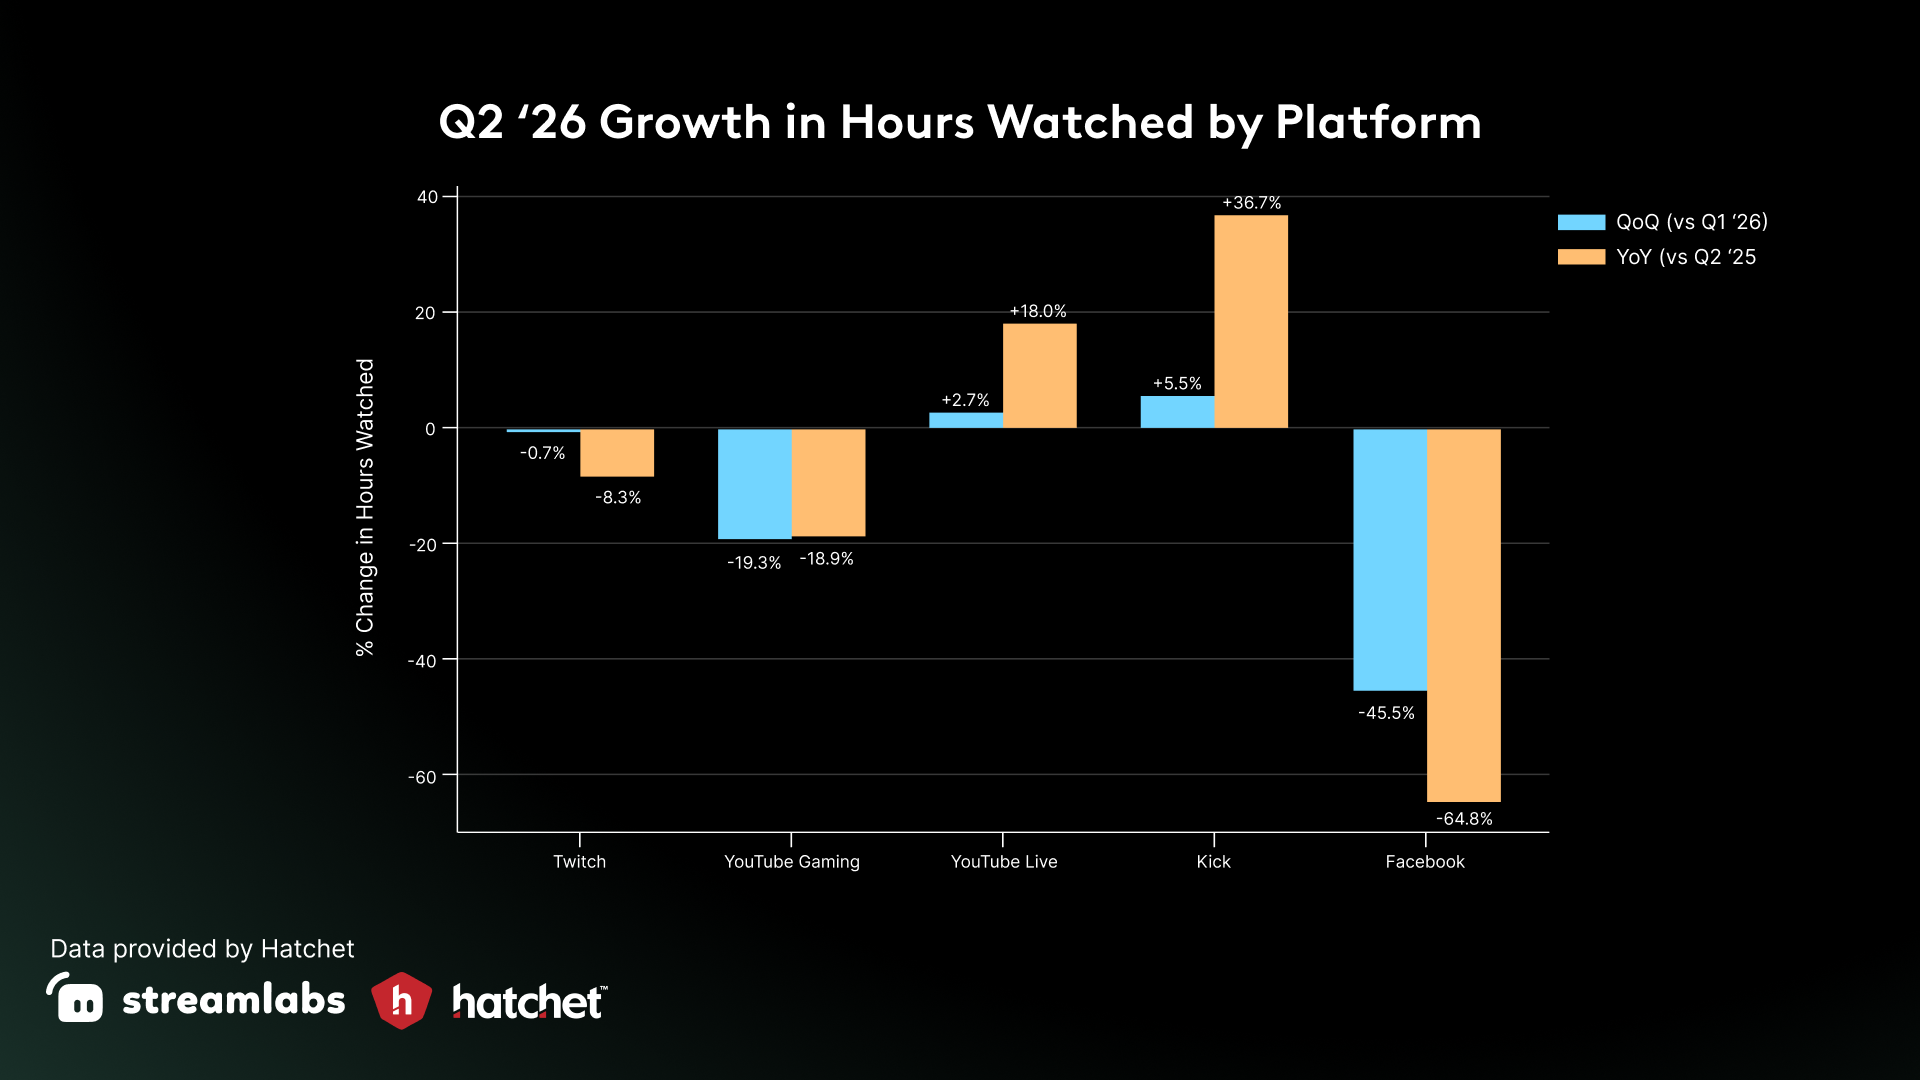
Hours watched: quarter-over-quarter and year-over-year
Hours streamed
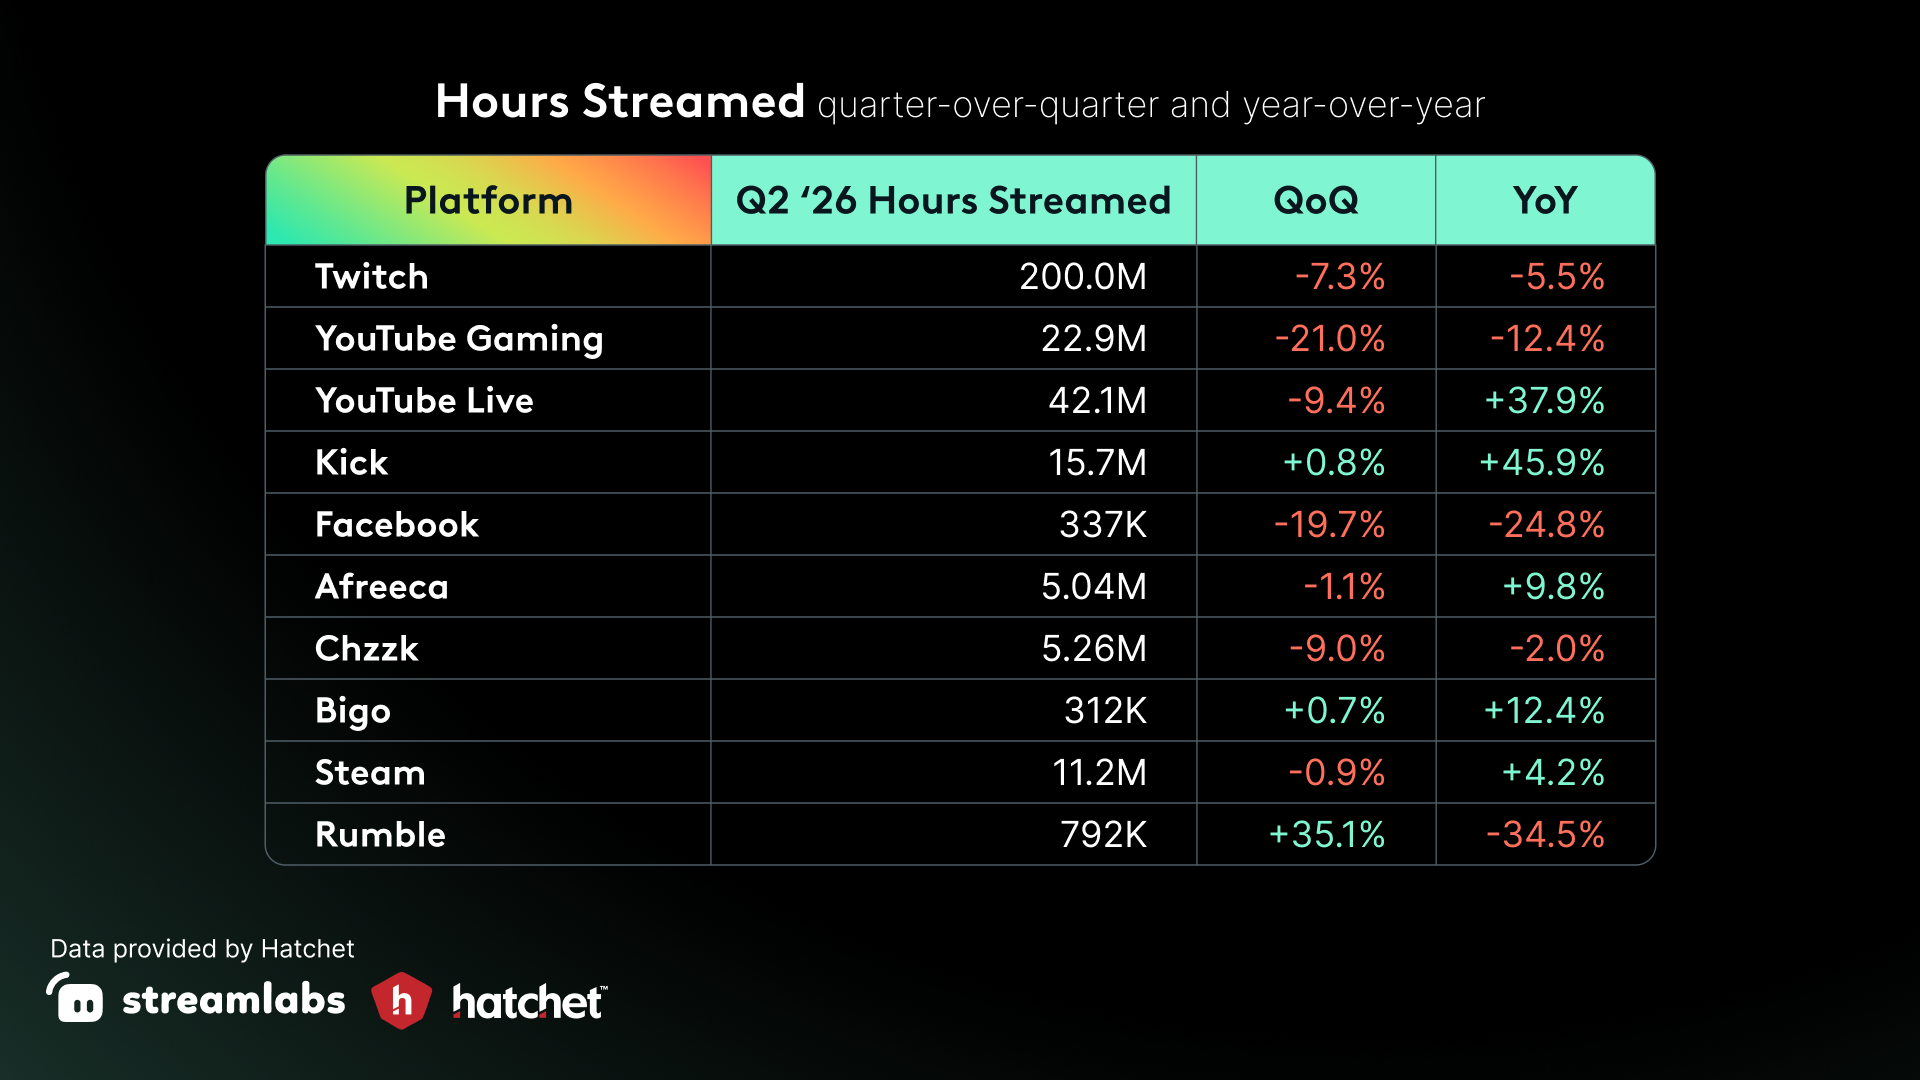
Hours streamed largely mirrored viewing trends. Kick grew the fastest, up 45.9% year over year, while YouTube Gaming fell 21.0% quarter over quarter and 12.4% year over year, in line with declines in watch time and unique channels.
Platform notes
Twitch
Twitch showed further signs of stabilization in Q2 2026. Hours watched fell just 0.7% quarter over quarter and 8.3% year over year to 4.52 billion, improving from a 13.7% annual decline in Q1. Average concurrent viewers per channel rose 7.2% to 22.6. Just Chatting remained Twitch’s top category at 670.5 million hours watched, with League of Legends a distant second.
YouTube (Live + Gaming)
YouTube’s two segments moved in opposite directions in Q2 2026. YouTube Live grew 2.7% quarter over quarter and 18.0% year over year to 12.97 billion hours watched, while YouTube Gaming fell 19.3% and 18.9%, respectively, to 1.79 billion. Unique Gaming channels also dropped 28.2% year over year, the steepest decline among major platforms. Some of the gap may reflect viewing shifting toward general YouTube Live placements rather than gaming-specific ones.
Kick
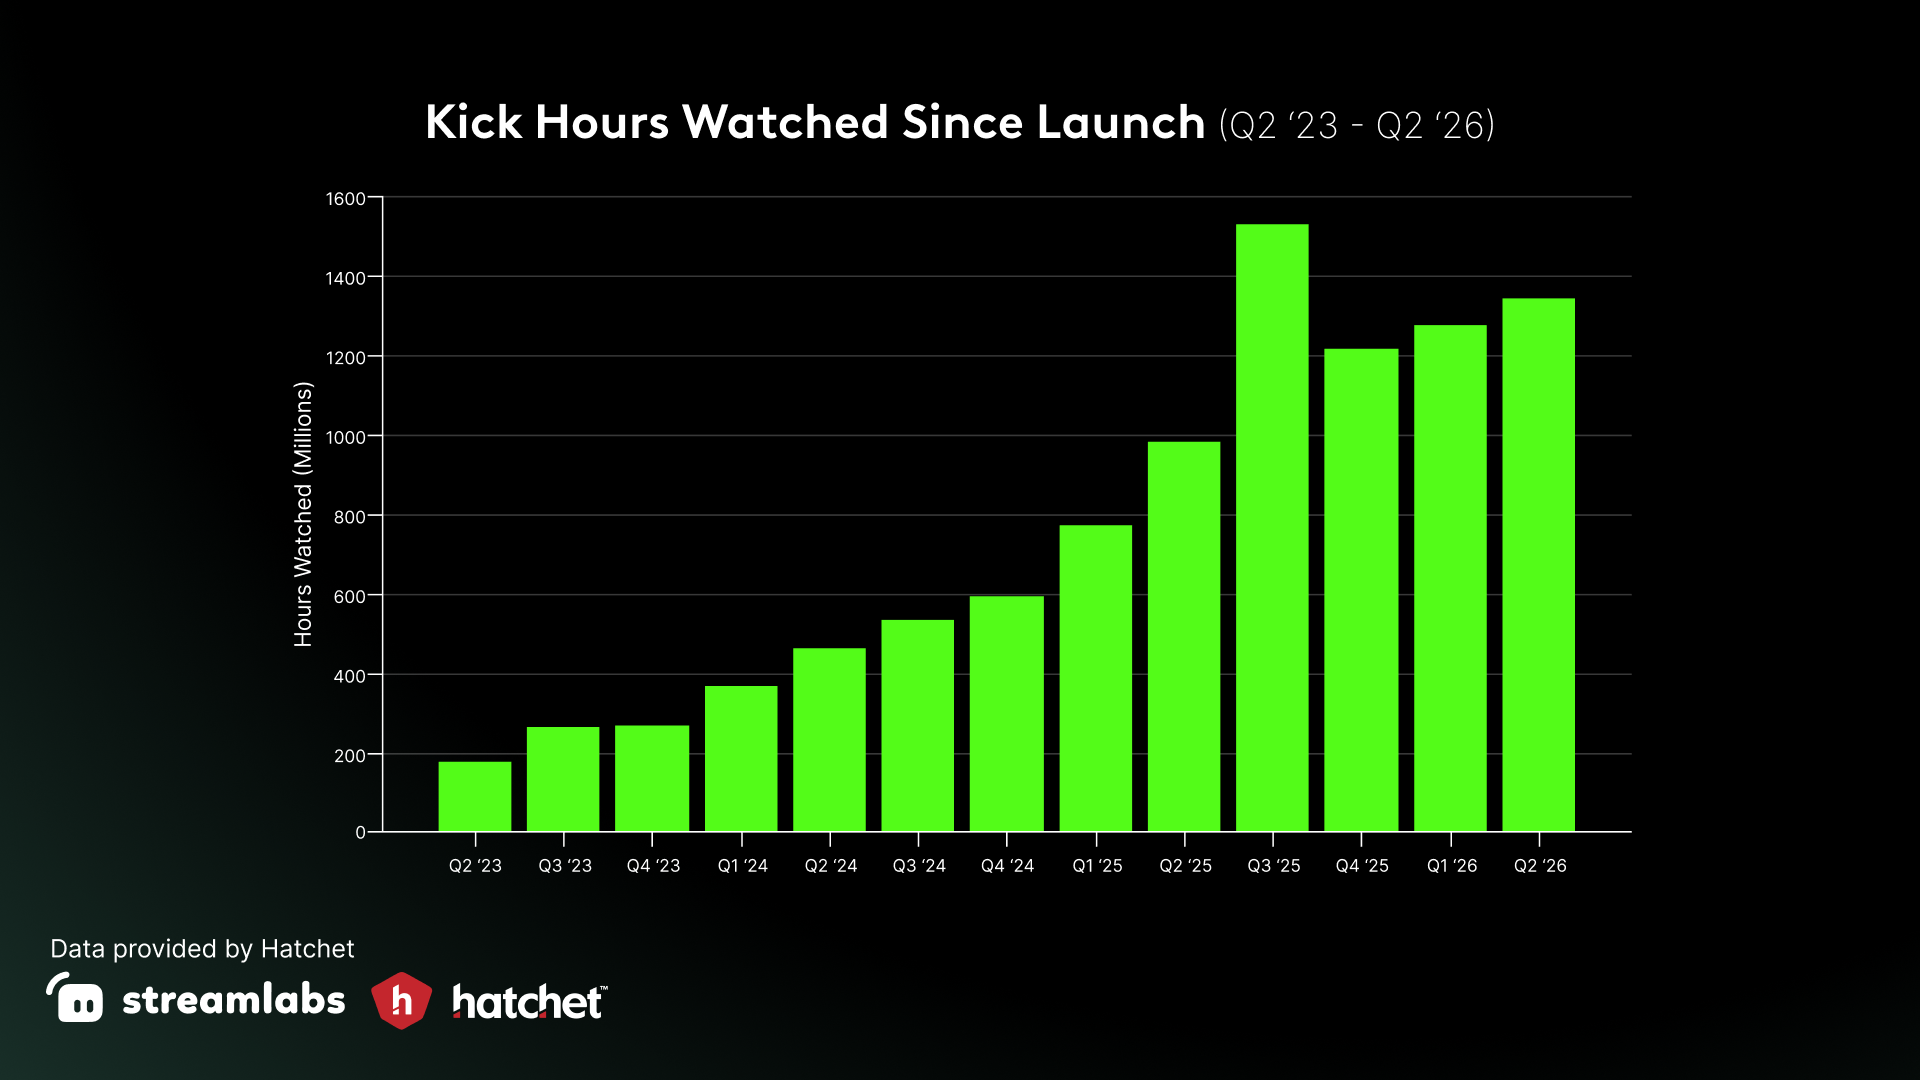
Kick remained the fastest-growing major platform in Q2 2026. Hours watched rose 5.5% quarter over quarter and 36.7% year over year to 1.34 billion, though annual growth slowed from 65.3% in Q1. Unique channels increased 45.5% to 807.7 thousand, while June delivered the platform’s strongest month of the quarter.
Facebook Gaming
Facebook Gaming continued its steep decline in Q2 2026. Hours watched fell 45.5% quarter over quarter and 64.8% year over year to 14.8 million, the lowest level in the dataset. Since Q4 2025, watch time has dropped more than 75%.
Other platforms (Afreeca, Chzzk, Bigo, Steam, Rumble)
Steam posted the strongest growth, up 56.7% quarter over quarter to 113.6 million hours watched. Rumble rebounded 16.1% to 79.4 million but remained down 37.1% year over year. Chzzk continued to grow (+9.4% QoQ, +19.4% YoY), while Afreeca was roughly flat and Bigo posted modest gains. None accounted for more than 1.5% of total watch time.
Creator activity
Creator metrics show how many channels are streaming, how much they broadcast, and how viewers are distributed across them.
Unique broadcasting channels
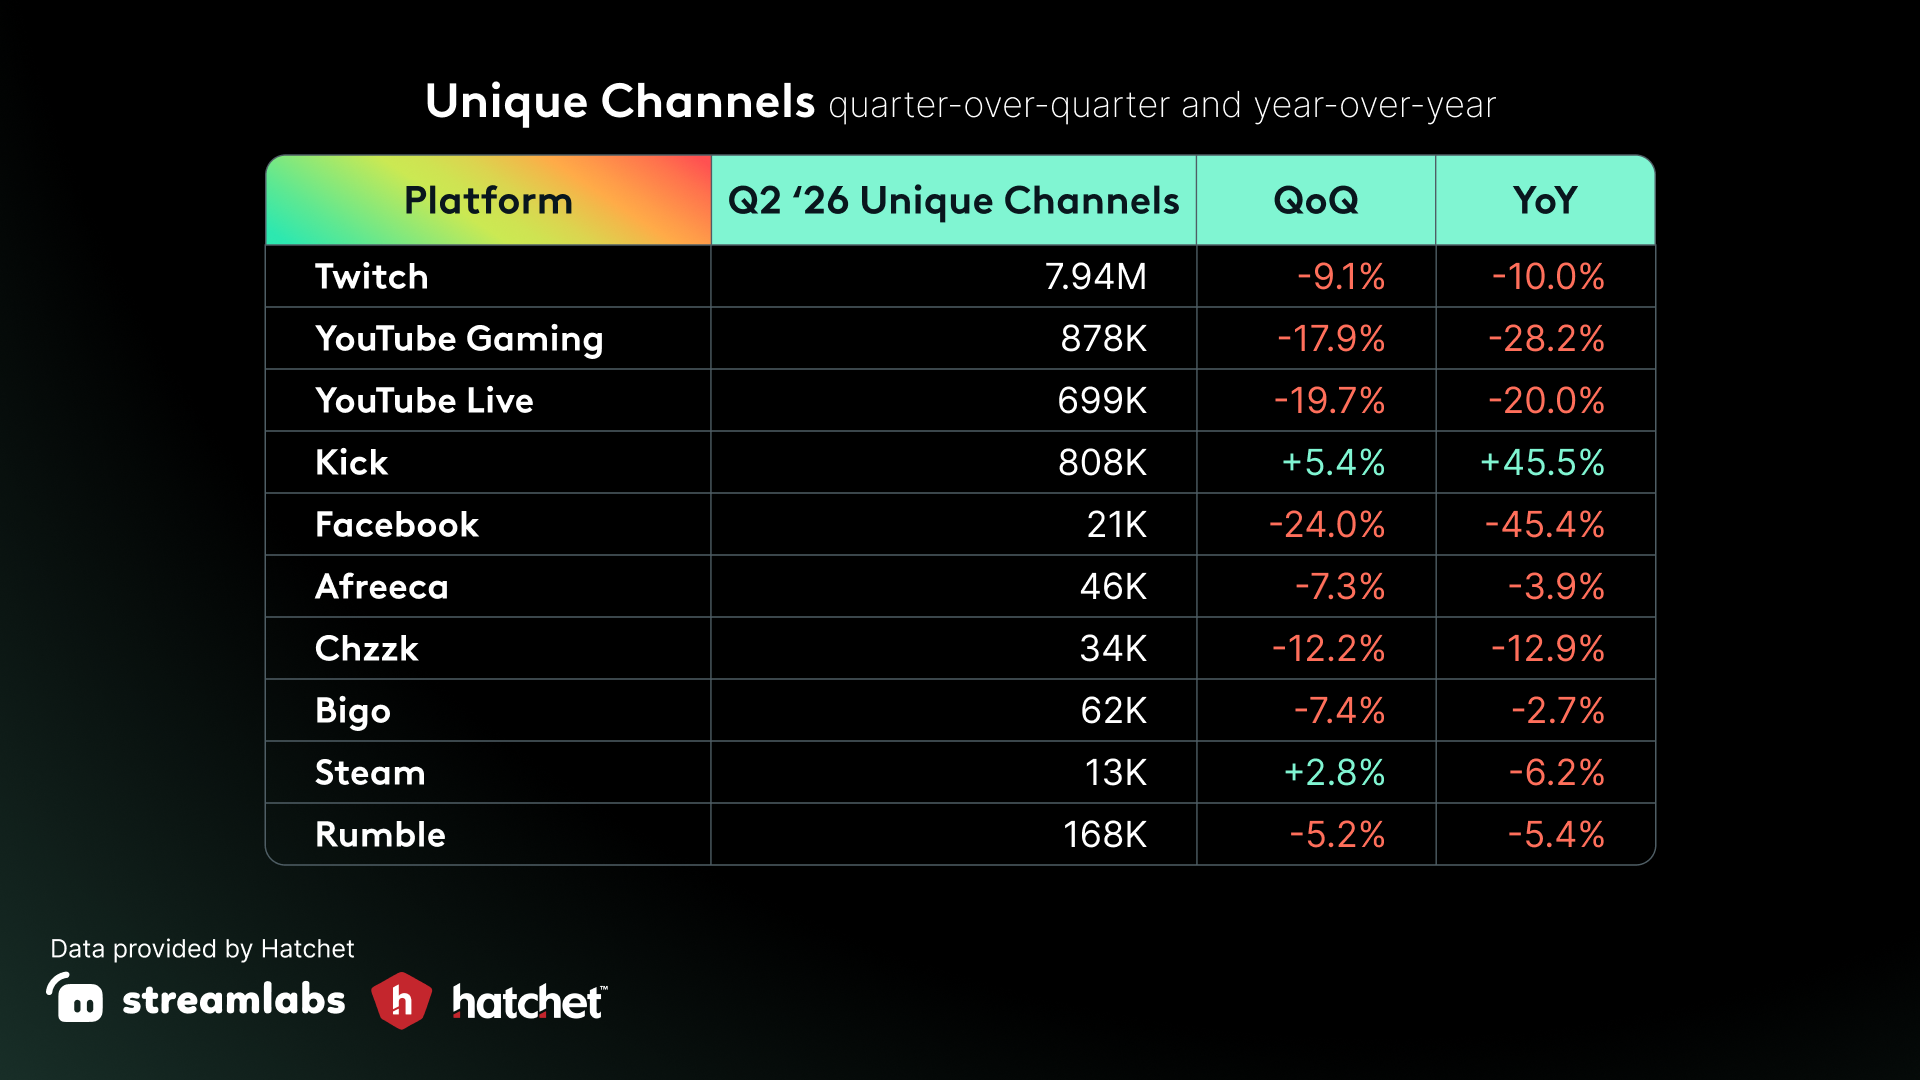
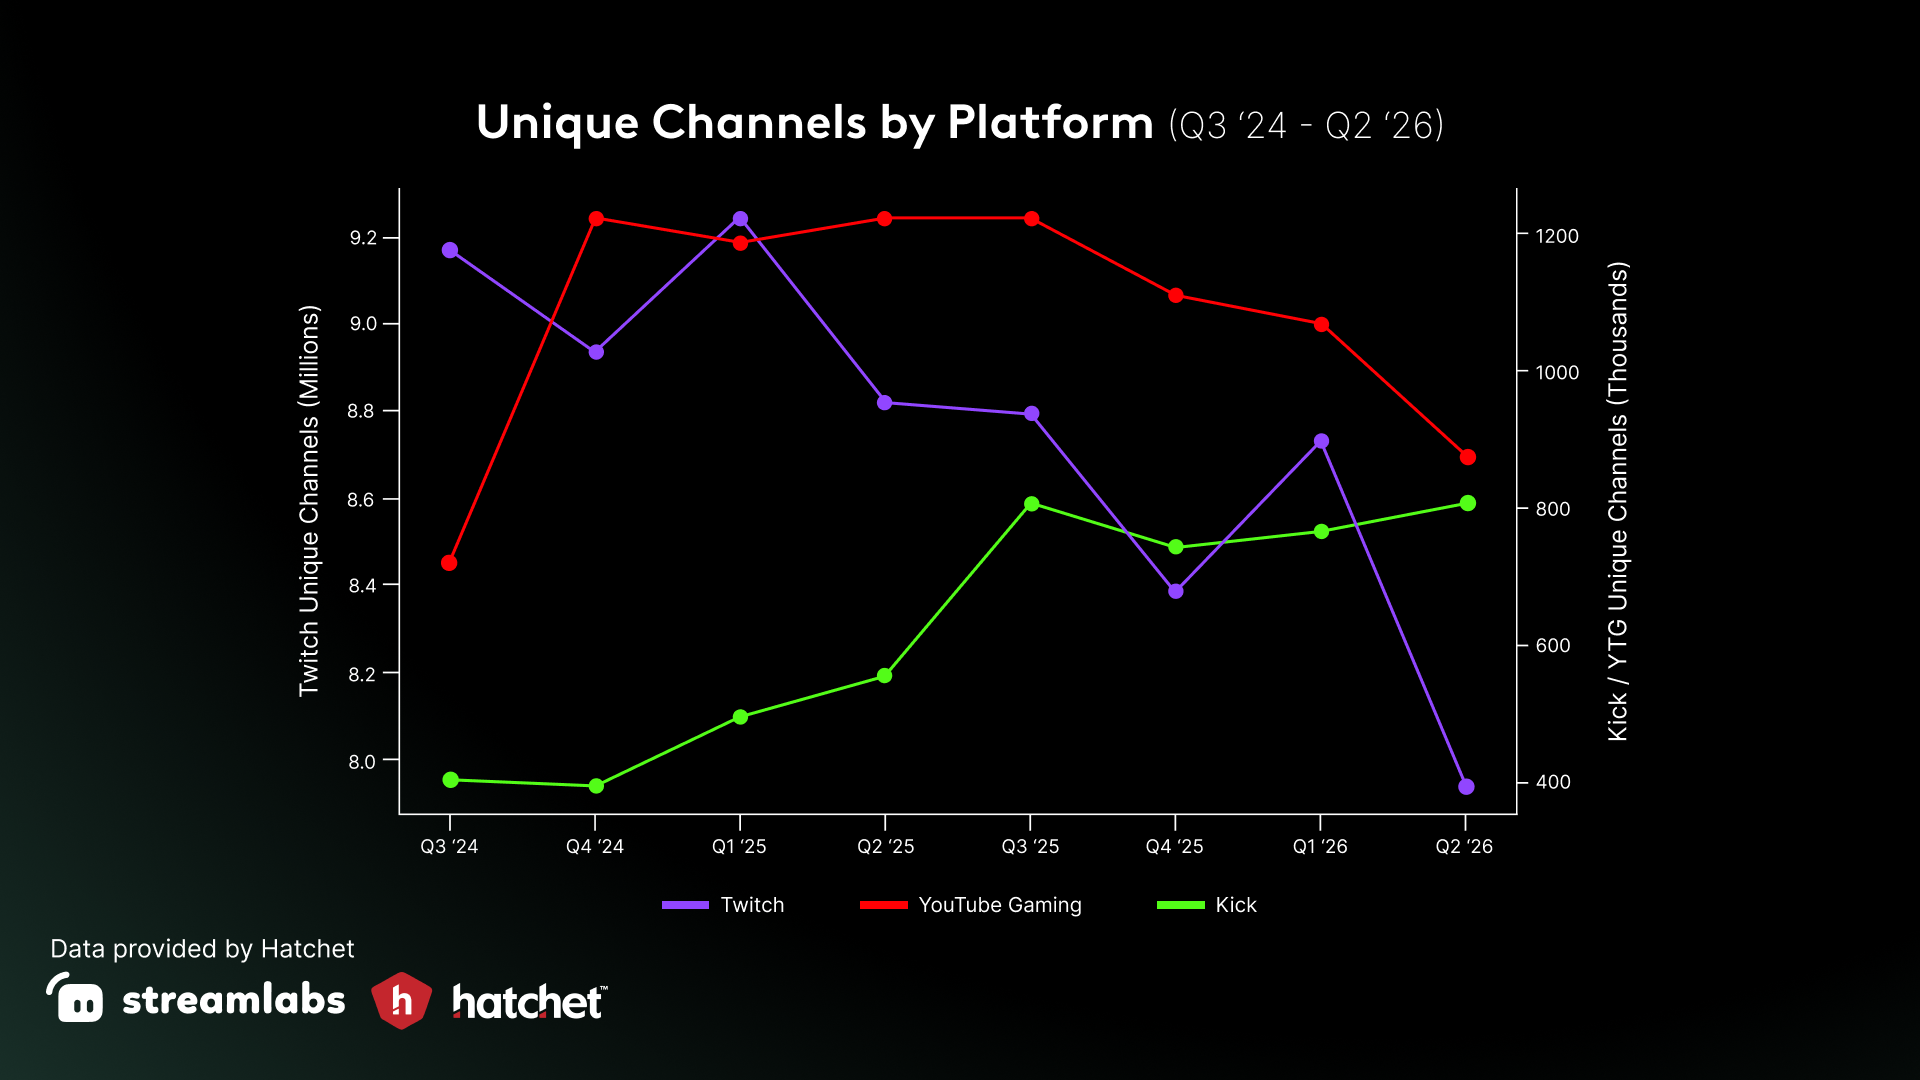
Unique channels declined across nearly every major platform in Q2 2026. Twitch fell 9.1% quarter over quarter to 7.94 million, YouTube Gaming dropped 17.9% to 878 thousand, and YouTube Live fell 19.7% to 699 thousand. Kick was the exception, growing 5.4% quarter over quarter and 45.5% year over year to 807.7 thousand channels.
Audience concentration: viewers per channel
YouTube Live had the highest audience concentration at roughly 308 viewers per channel, up 13.4% quarter over quarter but down 14.4% year over year. Kick followed at about 85 viewers per channel and YouTube Gaming at 78, both well above Twitch at roughly 23. This reflects their smaller creator bases relative to total viewership.
Audience behavior
Average concurrent viewership
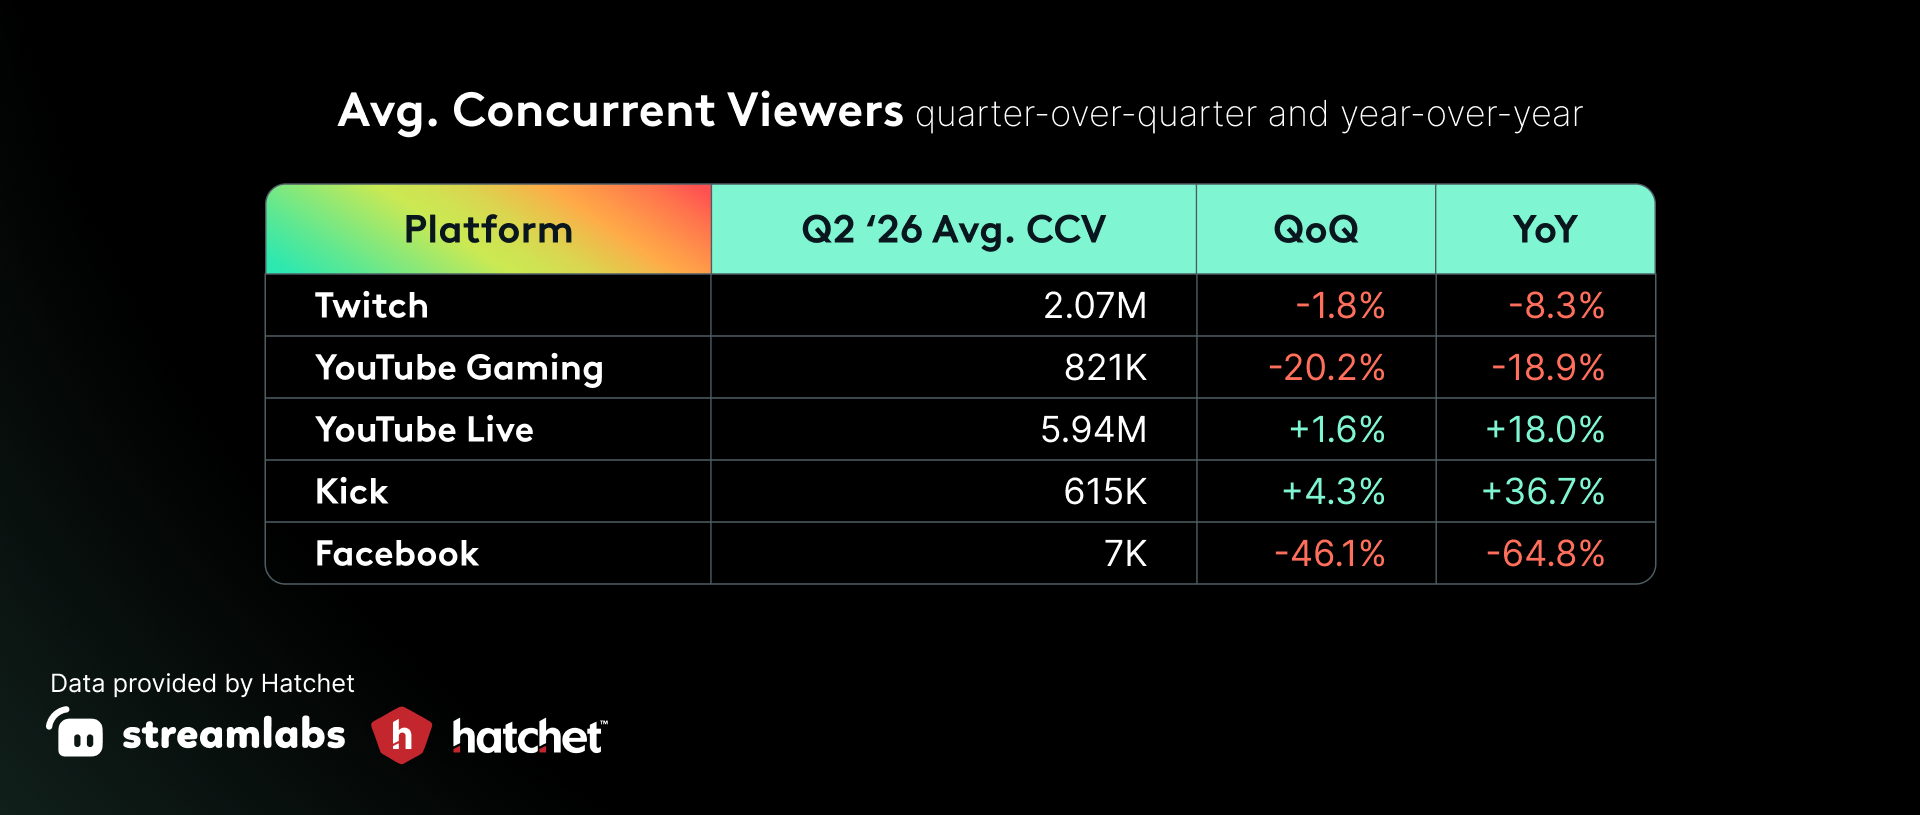
Average concurrent viewership mirrored watch-time trends. Kick grew 36.7% year over year and YouTube Live rose 18.0%, while YouTube Gaming fell 18.9% and Twitch declined 8.3% to 2.07 million.
Seasonality within the quarter
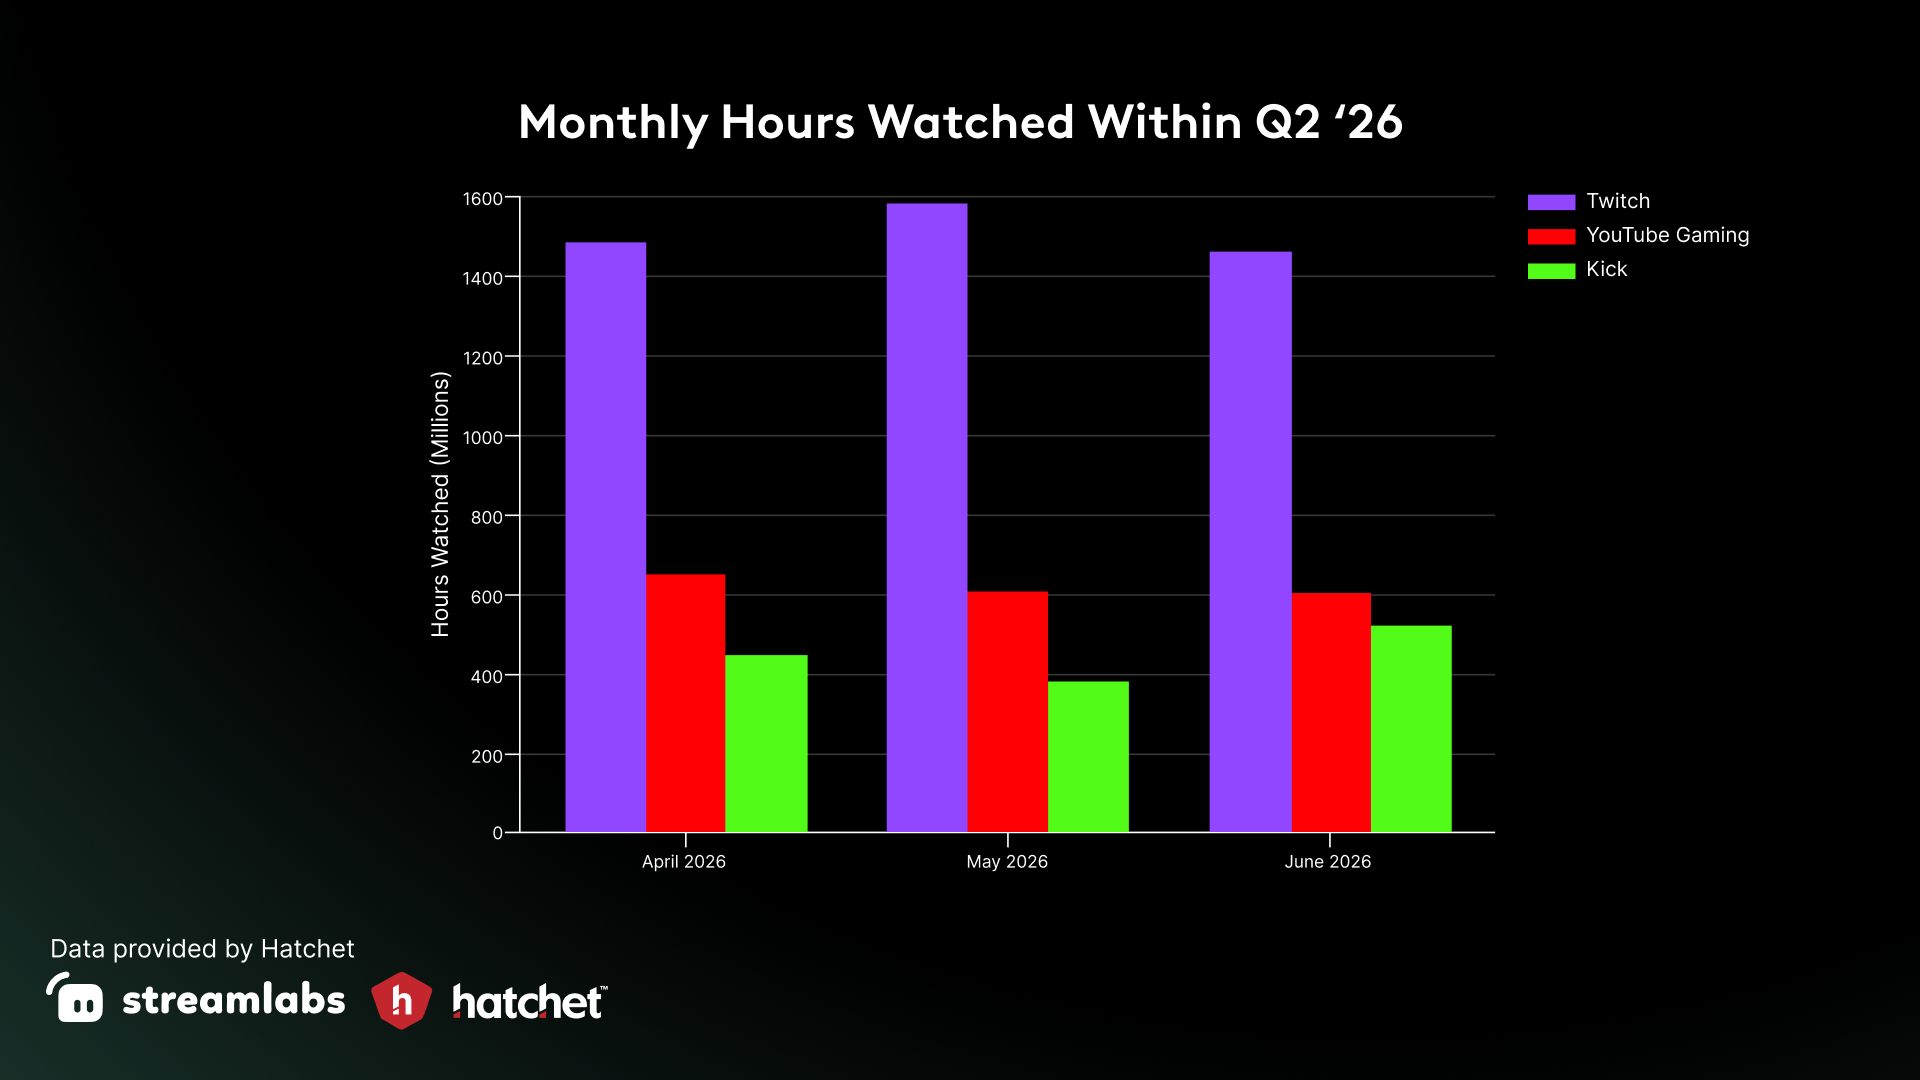
Monthly trends varied across Q2 2026. Twitch peaked in May before easing in June, while YouTube Gaming declined steadily throughout the quarter. Kick was more volatile, dipping in May before rebounding to 520 million hours watched in June, its strongest month of Q2.
Content trends
Top categories by platform, Q2 2026
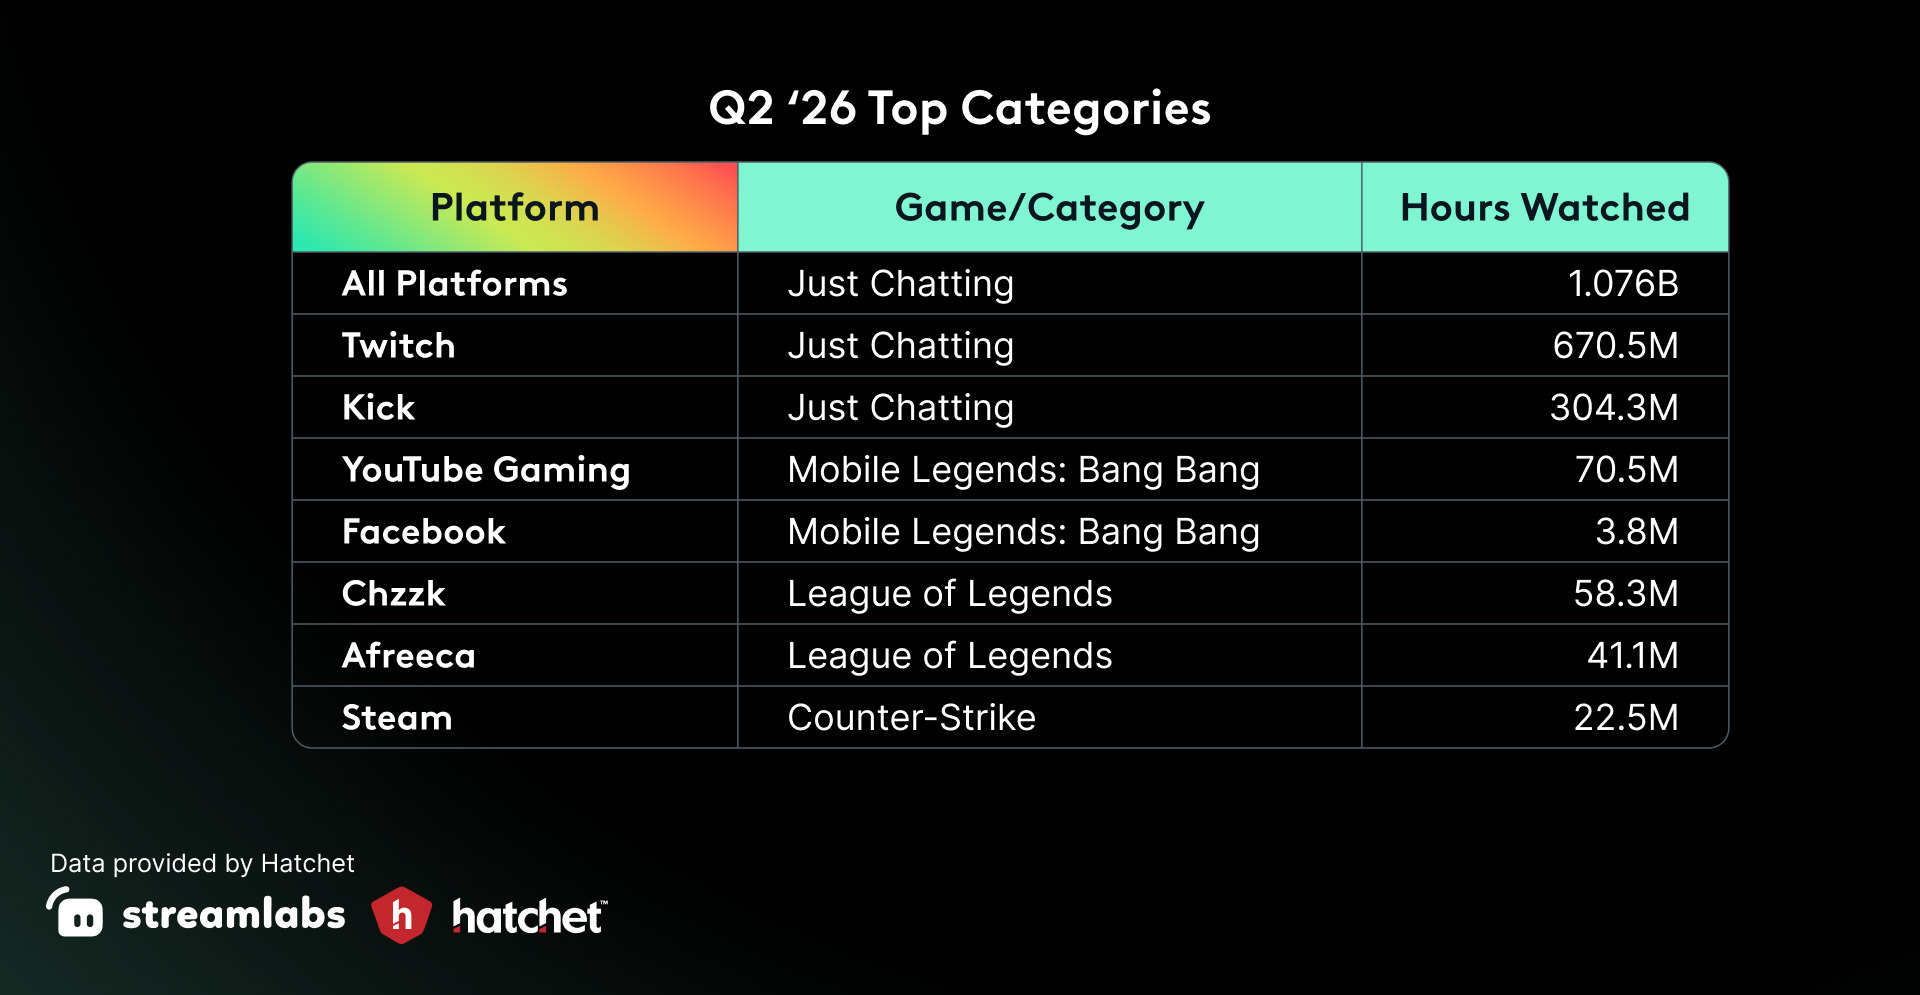
Just Chatting and other non-gaming content remained the industry’s biggest draw, leading overall and on both Twitch and Kick. League of Legends also had a strong quarter, topping Chzzk and Afreeca as Riot’s regional leagues and Mid-Season Invitational drove viewership.
Top genres
Non-gaming content led viewing on Twitch, Kick, Afreeca, and industry-wide, reaching 1.076 billion hours watched. MOBA content led on YouTube Gaming, Facebook, Bigo, and Chzzk. By contrast, first-person shooters were the most-streamed genre overall, highlighting a clear gap between what creators broadcast and what audiences watch.
Top publishers
Riot Games remained the top publisher across Twitch, YouTube Gaming, Afreeca, Chzzk, and industry-wide, with 535.8 million hours watched, down from 594.5 million in Q1. Rockstar led on Kick, Moonton on Facebook, and Valve on Steam.
Esports
League of Legends dominated Q2 2026 esports viewership, accounting for all three of the quarter’s biggest events:
- LCK Rounds 1–2: 87.7 million hours watched and 392,884 AMA.
- LEC Spring: 23.6 million hours watched and 190,279 AMA.
- Mid-Season Invitational: 9.4 million hours watched and a quarter-high 664,309 AMA.
This marked a shift from Q1, when the top events were split across Counter-Strike, VALORANT, and League of Legends.