Hello fellow adventurers! Streamlabs recently published two years worth of monetization and segmentation data (2015 & 2016) for Livestreams on Twitch in an industry report. We’re continuing that research by releasing an important quarterly update that for the very first time includes data about Youtube Live, and how it compares with Twitch.
➤ Report Highlights TL;DR
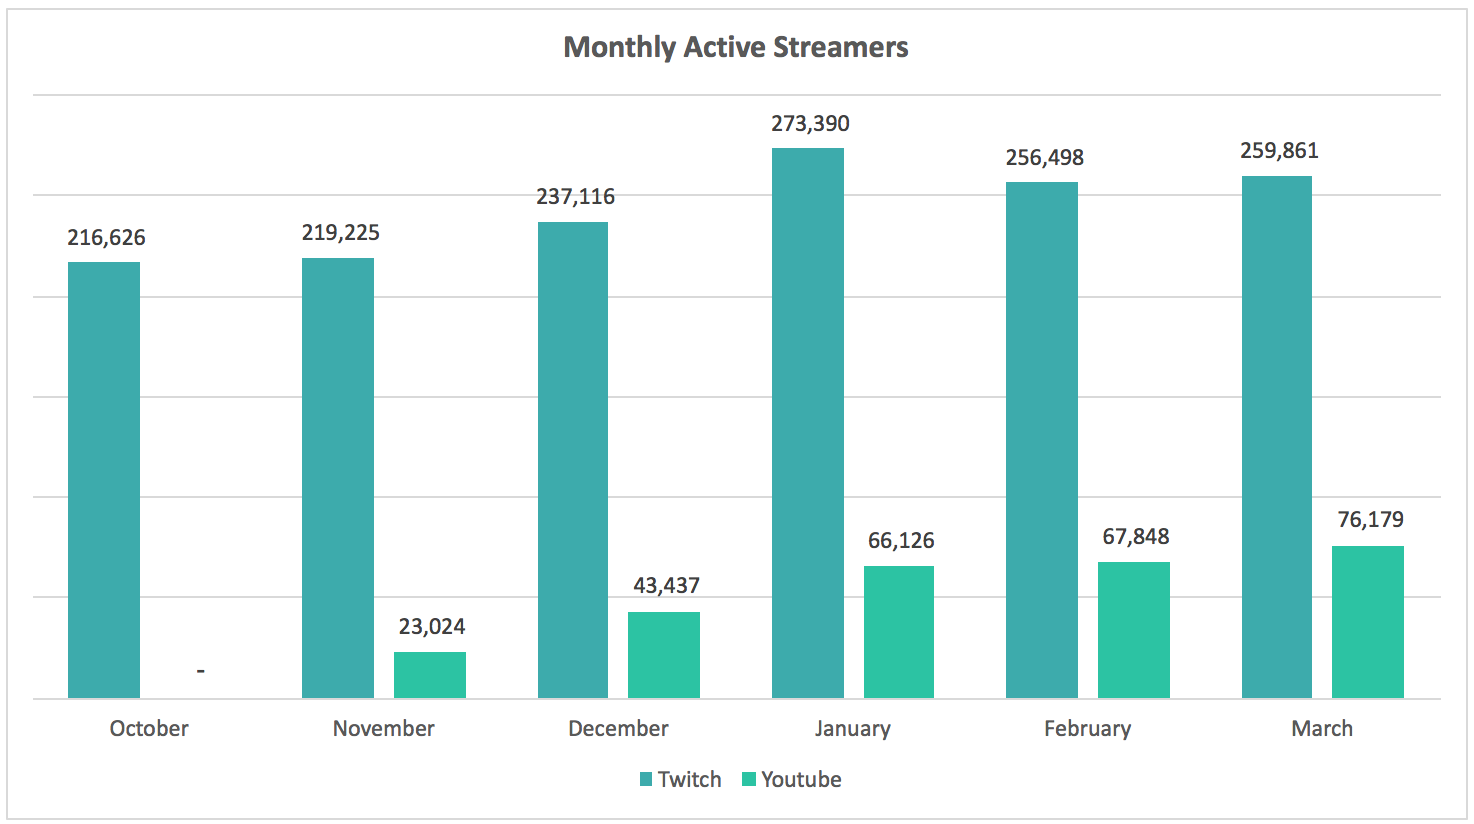
Monthly Active Streamers have grown 330% for Youtube Live vs 19% for Twitch in the past 5 months; and 36.6% for YouTube Live vs 4.1% for Twitch in the past 6 weeks.
Twitch generated 96% of Tips vs 4% for YouTube Live, monetizing much better;
Tipping volume is up 13% quarter-over-quarter, from $20.8 million processed in Q4 2016 to $23.5 million processed in Q1 2017;
ARPF (Average Revenue per Follower) is flat quarter-over-quarter;
Spending for long-time viewers (signed up 24+ months ago) is 253% more than new viewers (0–3 months old).
1. YouTube Live Is Outpacing Twitch In Streamer Growth


Active Streamers have grown 36.6% for YouTube Live vs 4.1% for Twitch in the past 6 weeks.
Twitch is still the industry leader and significantly larger in absolute terms, hence the percentage growth is a lot smaller than fast-growing YouTube Live. However given the growth rates we see, YouTube Live is now adding more unique streamers each month than Twitch, and in March reached 22.6% of our active streamers.
In the past month, YouTube Live has added 8,331 new streamers compared to 3,363 for Twitch.
Esports brings in new viewers, and those viewers stick around to see regular streamers. YouTube Live also has serious growth potential with the acquisition of rights to exclusively stream Faceit ECS and ESL Proleague. We expect some die-hard fans to switch over to YouTube Gaming from Twitch for such exclusive events.
If these growth rates continue at the same rate, we expect YouTube Live will be as large as Twitch in the next 18–24 months.
An important caveat to note about this data is that these are Streamlabs’ streamers who broadcast to these platforms, not all streamers on either of these platforms. Hence this data is more useful as a relative measure to compare different platforms and their usage, rather than absolute streamer counts (which may be markedly higher).
2. However, Twitch Generates A Lot More Money Than YouTube Live

Twitch generated a whopping 96% of the tipping volume for streamers compared to 4% for YouTube Live. Hence, more pro or semi-pro broadcasters choose to stream on Twitch given the opportunity to make more income, pay their bills, and pursue livestreaming as a viable career (see here for why monetization matters).
Twitch generated 96% of the Tips received, and was far more effective at monetization than YouTube Live
We attribute this to several factors:
- YouTube is seeing a lot more new streamers who are just starting out with livestreaming, and have not developed consistent livestream channels yet;
- Livestreaming has a deeper fan engagement level that is monetized at higher rates than pre-recorded video. Twitch is nearly 100% livestreaming, whereas YouTube is a mix of viewers hopping between pre-recorded videos and livestreams;
- Twitch has a more mature developer ecosystem and deeper APIs which allow for better third-party apps, deeper fan engagement, and more monetization;
- Viewers that have been watching for years tend to spend 2.5X more on average than viewers new to livestreaming (more data on this below).
However we believe that monetization and tipping volume are lagging indicators.
If YouTube Live can retain many of the new streamers that are trying them out, and develop many of Twitch’s more-advanced features, tipping volume should start to catch up to Twitch in 2018 as their viewers and streamers mature. If not, then Twitch will continue to dominate with pro and semi-pro streamers that draw most of the high-spending audience.
3. Long-time Viewers Spent 253% More Than New Viewers in Q1'17

This was the biggest surprise for us in writing this research report. We did not expect the differences to be this large.
Long-time Viewers (signed up 24+ months ago) spent an average of $81.10 each, 253% higher than New Viewers (0–3 months since signup) who spent $22.92 on average.
This shows that livestreaming is a long-term entertainment medium with tremendous potential. Fans not only continue to spend, but actually spend nearly 3X more as they get more engaged.
Streamers that stream consistently and have a regular following will generate 3X more income over 2–3 years when compared to streamers of the same size whose viewers come-and-go and churn frequently.
What will per-user spending look like after 5 more years of livestreaming? We can’t predict exactly, but its a safe bet that it will be substantially higher than today.
4. Total Tipping Volume Increased 13% Quarterly (Q1'17)

Streamlabs processed $23.5 million in Q1 2017, a 13.0% increase quarter-over-quarter from $20.8 million in Q4 2016.

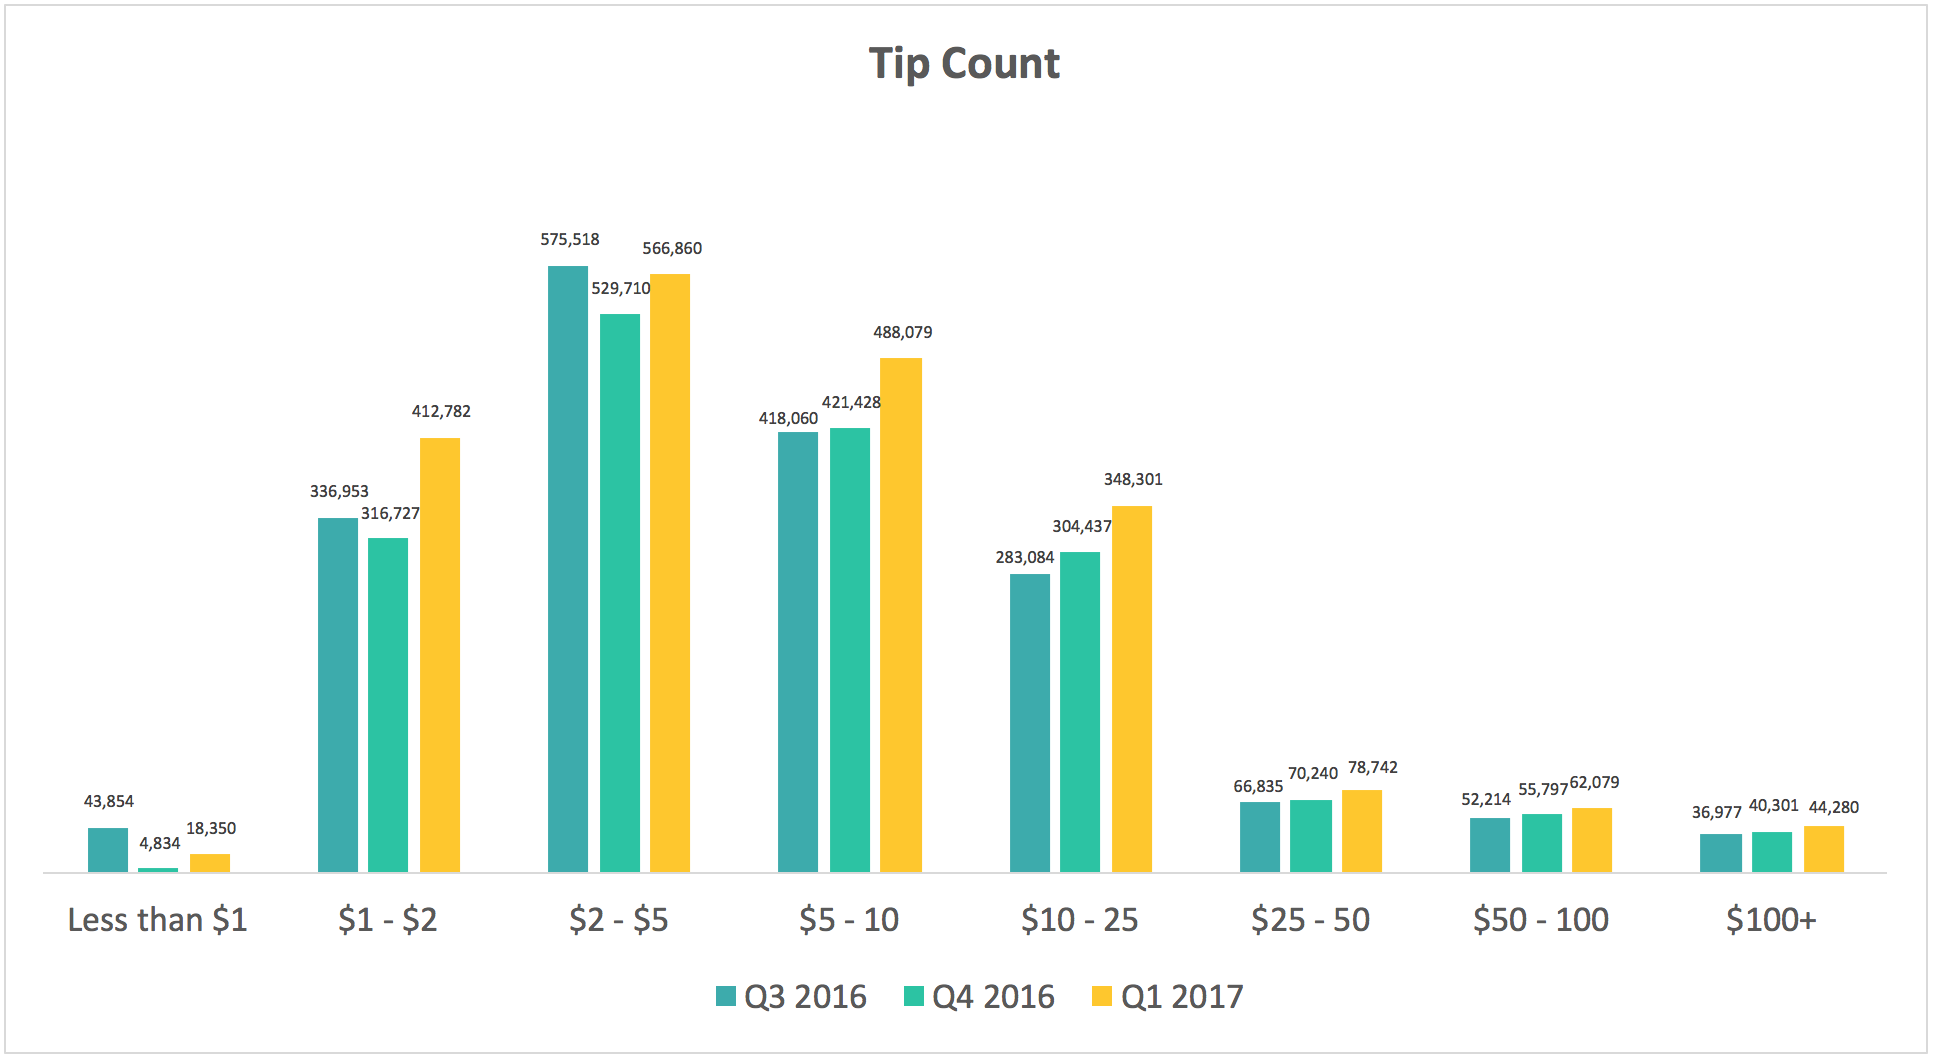
We saw a sizable drop in small tips in Q4 2016 during charity season when many more small tips($0 — $5) were given to charities instead of streamers. Larger ranges showed more consistent and steady growth.
The relative decrease in $1 tips is also due to increased usage of Cheering & Bits (Twitch virtual goods). For smaller transactions, viewers care less about what they use to support a streamer and pick whatever is more convenient. For larger transactions, they tend to pick tips since there is no rev-share or additional fees for streamers. Streamlabs keeps 0% fees, and all proceeds go to broadcasters.
For larger transactions, viewers tend to pick Tips over other methods since there are no additional fees for streamers. Streamlabs keeps 0% fees, and all proceeds go directly to broadcasters.
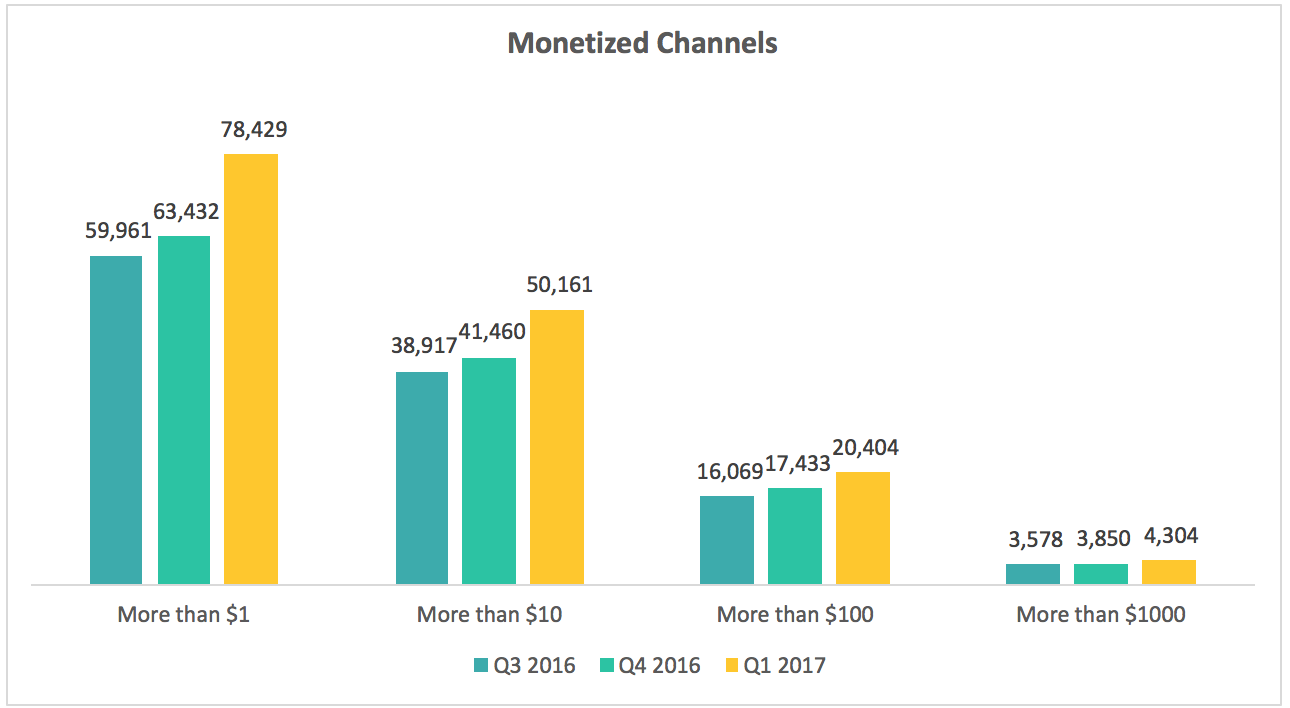
5. Number of Streamers Earning An Income Grew 24% Quarterly (Q1'17)


Number of monetized channels showed solid growth over Q1 2017. Especially in the range $100+ and $1,000+, where streamers would receive a meaningful amount of tips to make a career out of streaming, there is strong and sustained growth over the last 2 quarters. From Q3 2016 to Q1 2017, we saw a 27% and 20% jump in channel count of those received more than $100 and $1,000. It is encouraging to see more streamers who are finding a viable career path through livestreaming.
6. Share of Tip Volume For Non-Partnered Channels Rises to 42%

Smaller, non-partnered streamers received 42.1% of tips this quarter, compared to 38.5% in the previous quarter. More tips are going to smaller streamers which is healthy for the ecosystem.
Non-partnered streamers, who don’t have access to monetization tools like rev-share of ads, subscription and cheers, have always relied on tips as the primary way to monetize their channel. The significant increase from 36.5% in Q3 2016 to 42.1% in Q1 2017 is definitely encouraging to aspiring new streamers. More tips are being distributed among the long-tail of smaller streamers, which is good for the ecosystem as a whole since it encourages more and more people to livestream.
7. Average Revenue Per Follower (ARPF) Is Flat Quarter-over-Quarter
ARPF is calculated by dividing total income by total followers for all streamers using Streamlabs. ARPF is slightly up over 9 months, but flat quarter over quarter.

Want 0%-Fee Tips & Alerts For Your Channel?
Streamlabs provides a must-have suite of software tools for broadcasters to engage, monetize and grow their channels. We process tips for the majority of streamers, and are used by 78% of the largest 25K channels on Twitch and Youtube Live that use tipping. Get tipping & beautiful, live notifications for your channel.
Feedback? Let us know.