Hey Guys — its that time again when we release interesting quarterly data for live streaming. In this report we’ve included overall industry data for major live streaming platforms, in addition to Streamlabs’ internal data. This is the first-time we’ve collected and published this data on Twitch, YouTube Live, Periscope, Facebook Live and Microsoft’s Mixer.

➤ Highlights, TL;DR
Streamlabs MAU (Monthly Active Unique Streamers) rose 53% from the previous quarter to 514,000 for Twitch and YouTube Live. Twitch is growing again.
Twitch and YouTube Live are significantly ahead of Social Live Streaming platforms (Facebook Live, Periscope) in terms of broadcasters and viewers.
Over the last 2 quarters (Jan-Jun) Streamlabs processed ~$50M in tips, which is $7M more than the entire year in 2015. Projected $100m+ in tips for 2017.
Over 97 Million Alerts (real-time notifications) sent in Q2 by viewers showing increasing viewer spend and engagement.
53% MAU Growth, Twitch Growing Again, YouTube Keeping Pace

YouTube Live is continuing to grow at a healthy rate (51% growth) from earlier in Q1. The surprise here was Twitch (54% growth). After nearly 6 months of sluggish growth, Twitch has started growing again at a rapid clip due to several factors:
- Search & Discovery — By changing the default discovery from the largest channels to channels that you personally follow, and new features such as Pulse and Mobile recommendations, more streamers overall are getting new viewers. Twitch is fixing their discovery problem.
- Affiliates — By adding ~50K smaller, monetized channels called Affiliates, many more streamers have an easier aspirational goal to shoot for. Reduces churn, and encourages lapsed streamers to return.

Twitch & YouTube Live Are Leading Live Streaming Today


Twitch currently leads in the total number of average concurrent streamers and viewers that are live at any given point, while YouTube Gaming Live is a strong second. Both collectively are significantly ahead of Facebook Live, Periscope and Mixer in Avg. Concurrent Streamers and Avg. Concurrent Viewers, at least as it applies to non-private broadcasts open to anyone.
We believe that forms of live streaming that are working today are primarily based on the interest-graph, not the social-graph.

Broadcasting is a one-to-many medium, and the people who stick around the longest to view it are those that are fundamentally interested in the content (interest-graph). This is very different from just casually watching a live video of a friend (social-graph), where many viewers tune out after a few minutes of saying hello. Asynchronous videos (eg. Snapchat or FB Newsfeed VODs) seem to be a much better format of interacting with your social graph via video.
Data collection footnotes:
This data was collected over a seven-day period towards the end of Q2, and is an average of that period, not the entire quarter.
¹ YT Gaming: This only includes data for YouTube Gaming Live, not YouTube Live overall. We are limited by what data is available. YouTube Live is certainly much larger overall when other categories such as sports, entertainment, politics and mobile are included.
² Facebook Live: This data only includes public, openly-accessible-to-anyone broadcasts. The majority of live broadcasts on Facebook are to friends-only, or privacy-restricted, and hence not open to everyone. Thus the total broadcasts and viewers on Facebook Live are much, much higher, but that data is privacy-restricted and not available. However when looking at open broadcasts on Facebook, it does enable a somewhat apples-to-apples comparison with other openly-accessible broadcasts on other platforms.
³ Estimated Viewers: YouTube and Periscope viewers are calculated using this. These are calculated by directly measuring the concurrent viewers in at least 25% of the broadcasts, and then extrapolating from measured averages to cover the total number of broadcasts.

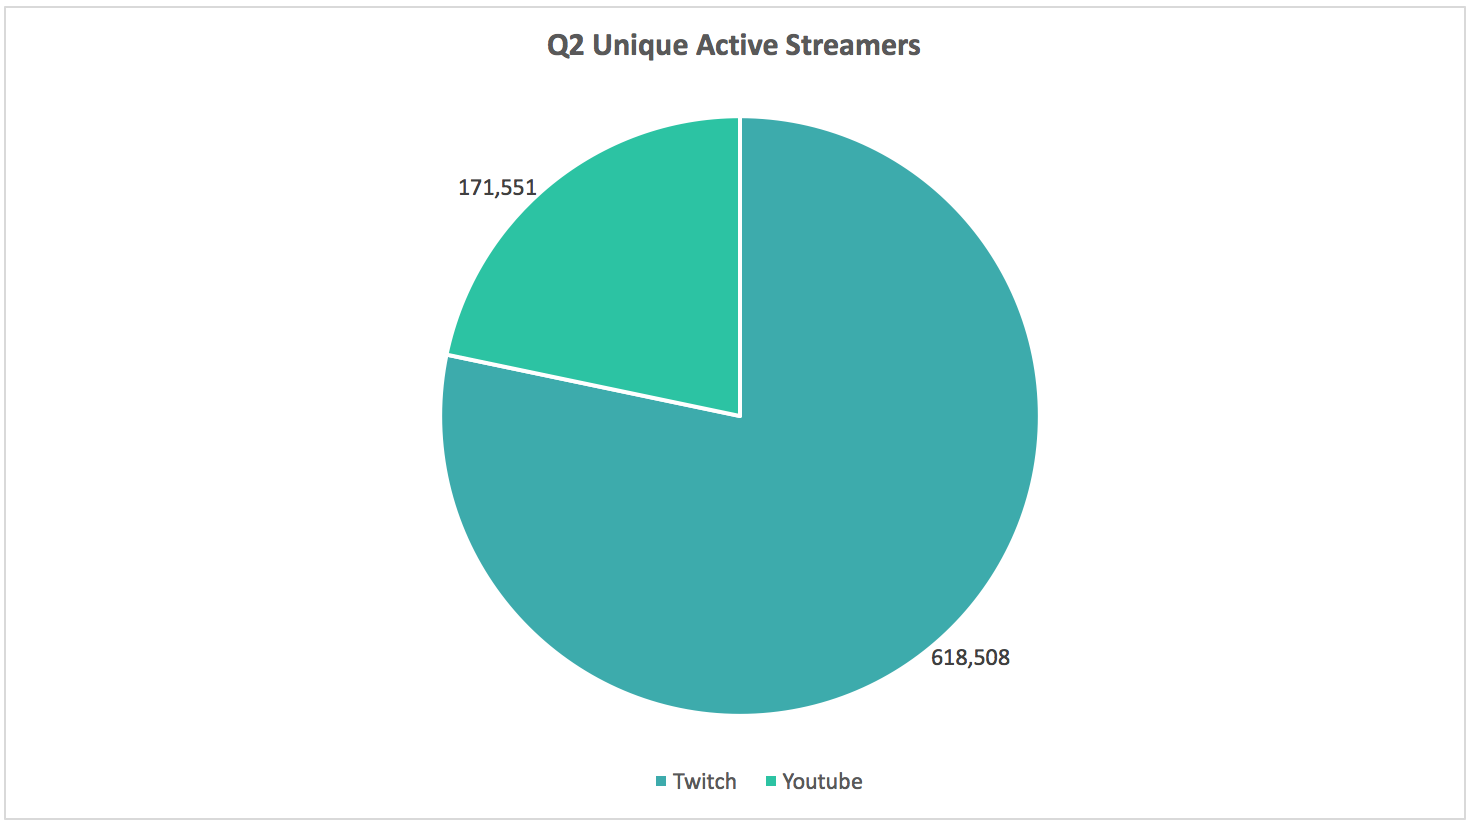
YouTube Live now accounts for 23% of Streamlabs’ Active Streamers

$100M in Tips Projected For Streamlabs in 2017
Tipping volume is on the rise for the year, surpassing the total of $43M for 2015, and on pace to hit the $100M milestone.


Additionally, there were over 500K unique streamers over the quarter that streamed League of Legends’, making it the #1 game on Twitch, bringing in $1.96M in tips.
Over 2 million people streamed the game League of Legends between April and June, making it the #1 streamed game in Q2
Overwatch was the #2 game streamed on Twitch, with over 300K unique streamers playing on the platform, bringing in more than $900k in tips, and streamed by more than 330K unique streamers.
# of Monetized Channels Grow 13%


97 Million Alert Notifications Sent — Viewer Engagement Is Growing
Having an engaged audience is key to building your base. For the quarter there were over 97M alerts sent out by viewers showing us that viewers are extremely dedicated to supporting their favorite streamer and vying for their attention
For the next quarter we will be able to include internal numbers from all four platforms: Twitch, YouTube, Mixer, and Facebook Live. We anticipate seeing an increase in monthly active users and more hours of games being streamed. As we get closer to the end of the year, continue to check in with us to see if we are still tracking to hit $100M in tips or surpassing it.
Also, be on the lookout for some exciting news coming from us in the very near future.
Happy Streaming! Stay Calm, Stream On.
