Key Takeaways
- Audiences watched over 7.46 billion hours of content across all live streaming platforms. This number is slightly down from last quarter (7.71 billion hours in Q2). Year-over-year, the live streaming industry grew by 91.8%, compared to 3.89 billion hours watched in Q3 2019.
- YouTube Gaming experienced the most growth for hours watched with an increase of 156M hours from Q2 to Q3.
- Facebook Gaming surpassed 1 billion hours watched for the first time.
- Following the shutdown of Mixer, the majority of its streamers appear to have gone to Twitch. Twitch now represents 91.1% of the market share for hours streamed, up 14.5% from last quarter. This massive increase can be attributed to Mixer’s shutdown, which captured 14.2% of all content live-streamed last quarter. That is compared to Facebook Gaming, which now represents 3.4% of the market share, and increased by 1% since last quarter, and YouTube Gaming, which now represents 5.5% of the market share, and decreased by 1.2% since last quarter.

Twitch
Despite the total hours watched on Twitch decreasing by 377 million, they managed to break their record for the number of hours streamed on the platform. In addition, thanks in-part to Mixer’s shutdown, Twitch’s market share for hours streamed increased by a massive 14.5%.
Total Hours Watched
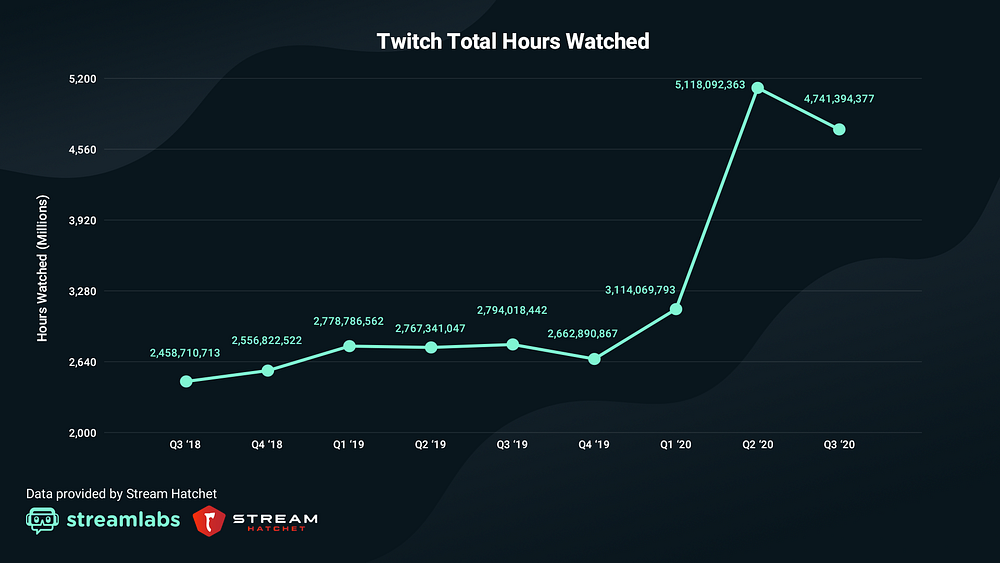
- Viewers watched 4.74 billion hours of content on Twitch in Q3, an 8% decrease from 5.12 billion hours In Q2.
- Twitch still holds a significant lead over Youtube Gaming, which is at 1.68 billion hours, and Facebook, which is at 1.04 billion hours.
- Twitch experienced a 70% increase in year-over-year growth compared to Q3 2019’s 2.79 billion hours watched.
- Twitch now represents 63.6% of the market share for hours watched, down 2.7% from last quarter compared to Facebook and YouTube.
Total Hours Streamed
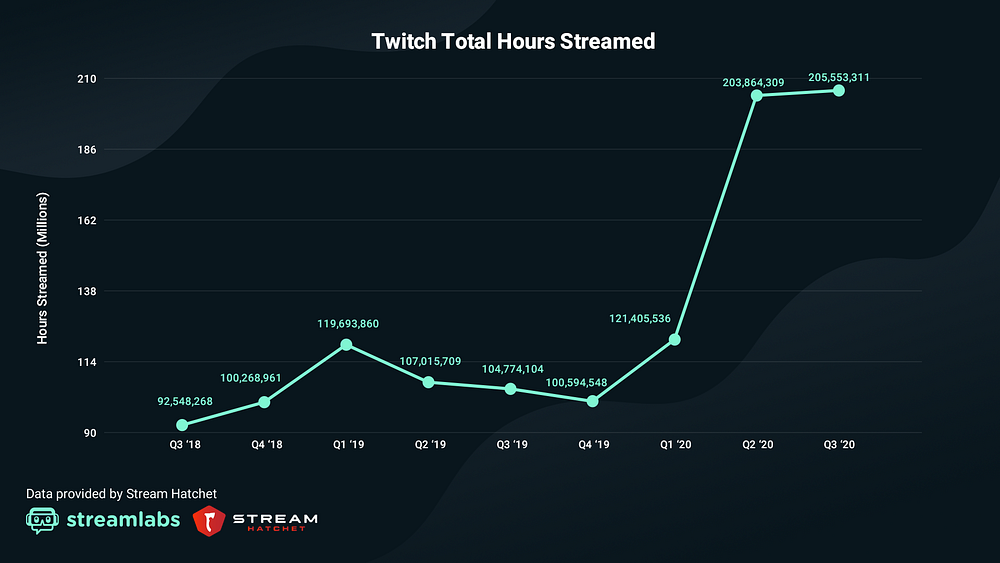
- After experiencing a massive 68% increase from Q1 (121 million hours) to Q2 (203 million hours), Twitch has managed to sustain its record-breaking numbers in Q3.
- Live streamers broadcasted 206 million hours of content on Twitch in Q3, a 1% increase from Q2.
- Twitch had over 185 million more hours of content streamed to its platform in Q3 than Facebook and YouTube combined.
- Twitch experienced a 96% increase year-over-year for hours streamed compared to 105 million hours in Q3 2019.
- Twitch now represents 91.1% of the market share for hours streamed compared to Facebook and YouTube, a 14.5% increase from last quarter. This massive increase can be attributed to the shutdown of Mixer, which captured 14.2 of all content live-streamed last quarter.
Unique Channels
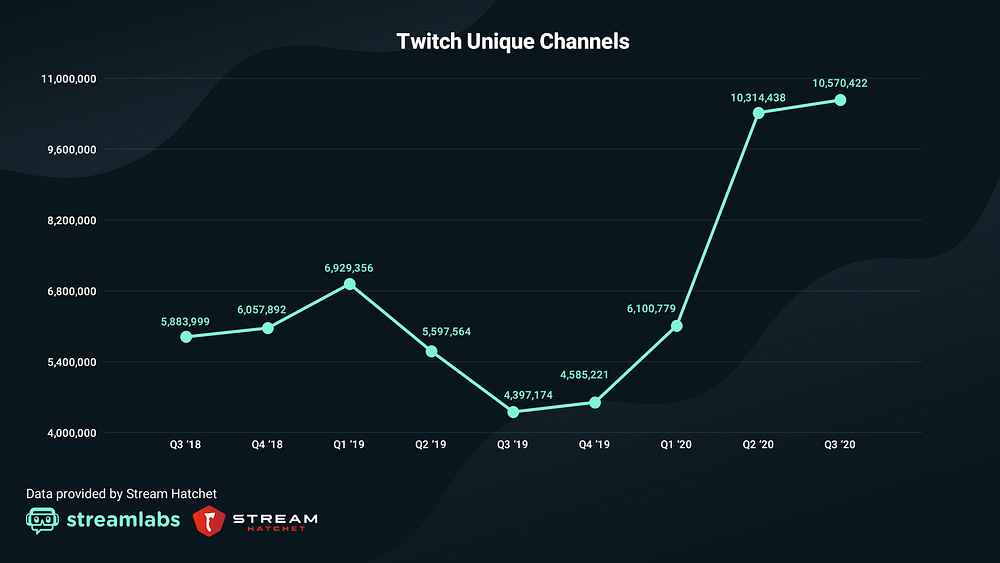
- The number of unique channels streaming on Twitch reached 10.6 million in Q3, up 2.8% from 10.3 million channels in Q2.
- Considering Twitch managed to sustain this high number after surging 69% in Q2 (due in part to COVID-19 lockdowns), it is a strong indication that Twitch will continue to hold its position as the leading streaming platform for many months to come.
- Year-over-year, Twitch experienced a 141% increase from 4.4 million channels in Q3 2019.
Average Concurrent Viewership
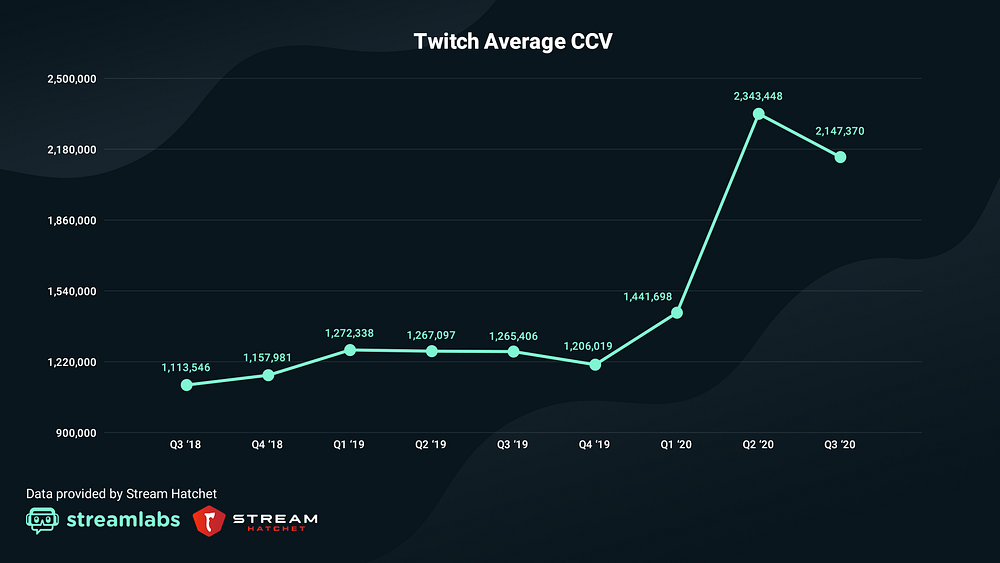
- The average concurrent viewership on Twitch reached 2.15 million viewers, decreasing by 8% compared to Q2's 2.34 million.
- Year-over-year, Twitch experienced a 69% increase in average concurrent viewership compared to Q3 2019’s 1.27 million).
YouTube Gaming
Compared to Twitch and Facebook, YouTube Gaming experienced the largest increase in hours watched in Q3. YouTube secured an additional 155 million hours watched in Q3 compared to the previous quarter. For context, hours watched on Twitch decreased in Q3 by 377 million hours, and Facebook increased by 71 million. Despite growing its viewing audience, YouTube Gaming could not increase the number of streamers using the platform.
Total Hours Watched
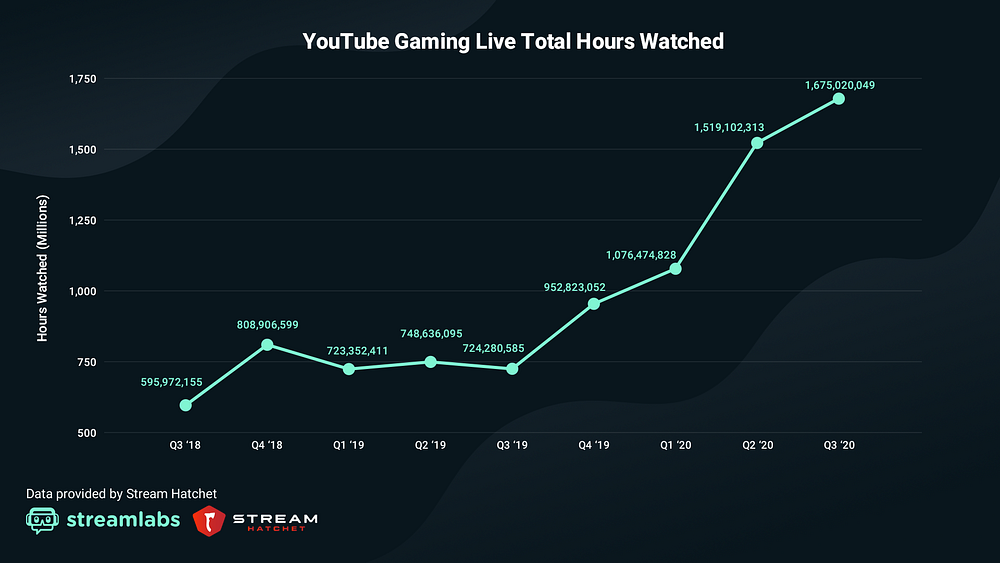
- Viewers watched 1.68 billion hours of content on YouTube Gaming in Q3, a 10.5% increase from 1.52 billion hours In Q2.
- Year-over-year, YouTube Gaming experienced a 132% increase from 724 million hours watched in Q3 2019.
- YouTube Gaming now represents 22.5% of the market share for hours watched, increasing 2.8% from last quarter.
Total Hours Streamed
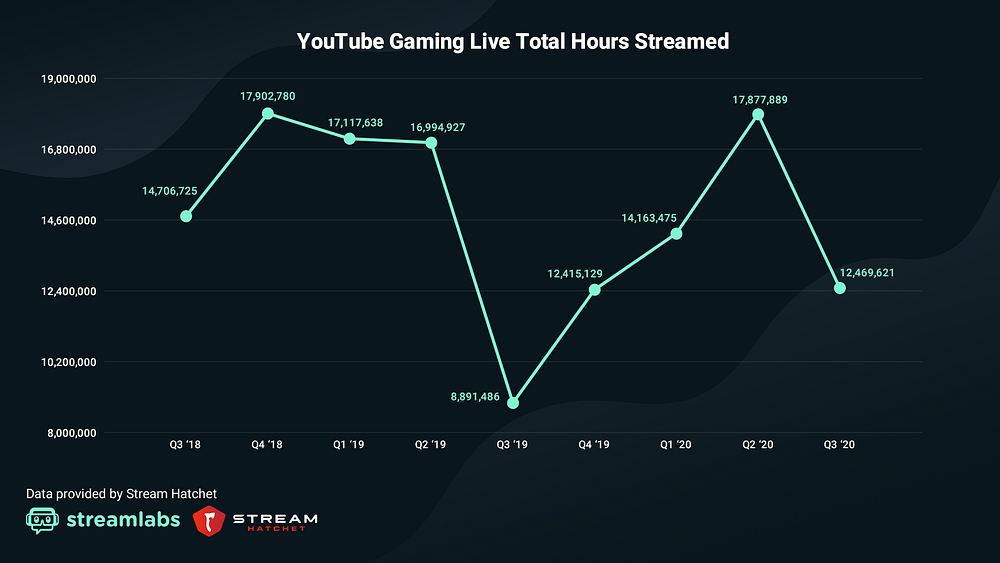
- Live streamers broadcasted 12.5 million hours of content on YouTube Gaming in Q3, a 30.2% decrease from 17.9 million hours in Q2.
- Year-over-year, YouTube Gaming experienced a 40% increase from 8.9 million hours watched in Q3 2019.
- YouTube Gaming Live represents 5.5% of the market share for hours streamed a 1.2% decrease from last quarter.
Unique Channels
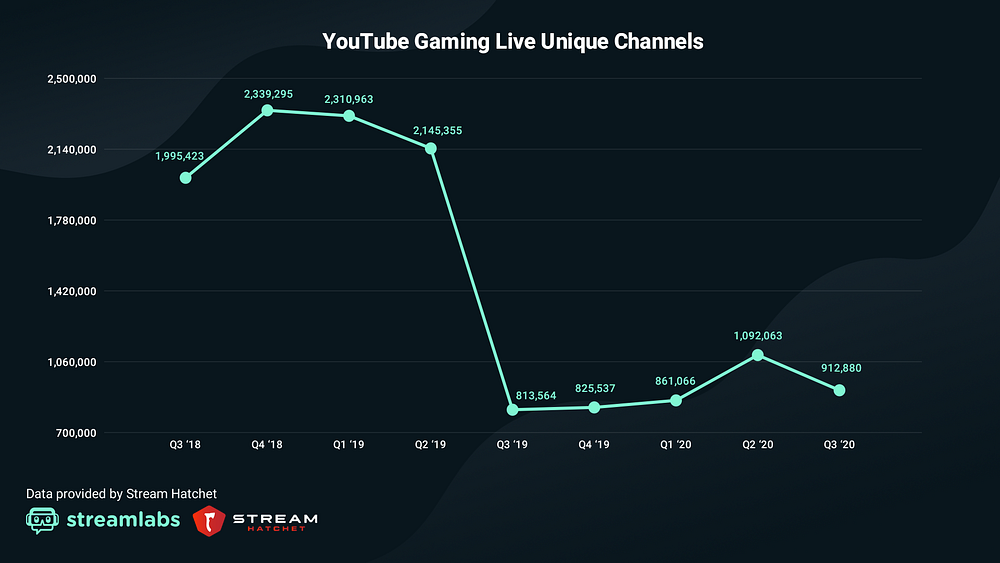
- 913,000 unique channels streamed to YouTube Gaming in Q3, decreasing by 17% from 1.1 million channels in Q2.
- Year-over-year, YouTube Gaming experienced a 12.2% increase from 4.4 million channels in Q3 2019.
Average Concurrent Viewership
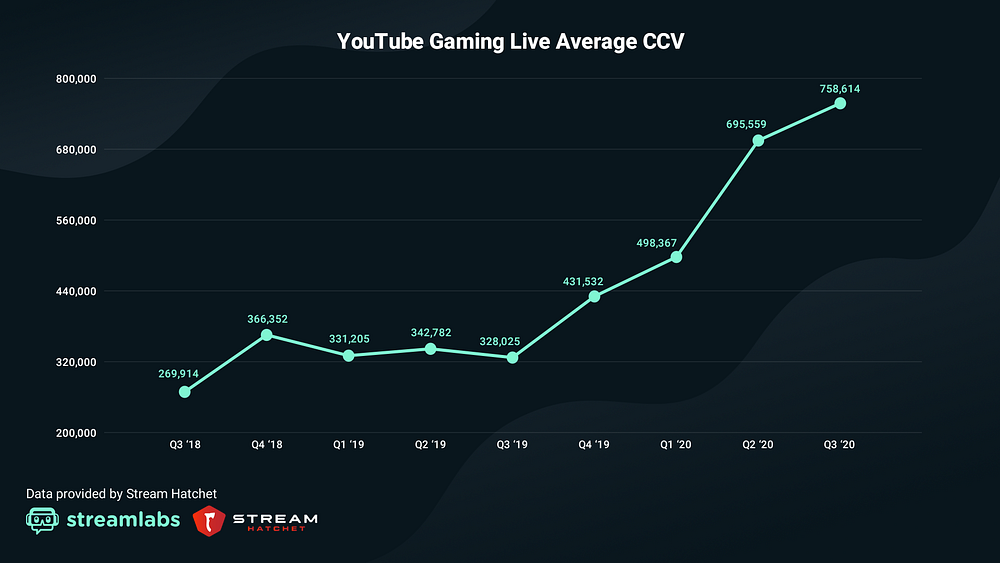
- The average concurrent viewership on YouTube Gaming reached 759,000 viewers, increasing by 9.1% compared to Q2’s 696,000.
- Year-over-year, YouTube Gaming experienced a 131% increase in average concurrent viewership compared to 328,000 in Q3 2019.
Facebook Gaming
Over the last three quarters, growth from Facebook Gaming has been skyrocketing. While it appears Twitch captured the majority of Mixer’s streamers, Facebook Gaming still appears to have benefited. Following Mixer’s announcement to shut down, they partnered with Facebook Gaming and encouraged their streamers to join the platform. At the time, it was unclear whether or not streamers would opt to join the platform, but according to recent data, Facebook Gaming has experienced increases for both hours watched, hours streamed, and unique channels.
Total Hours Watched
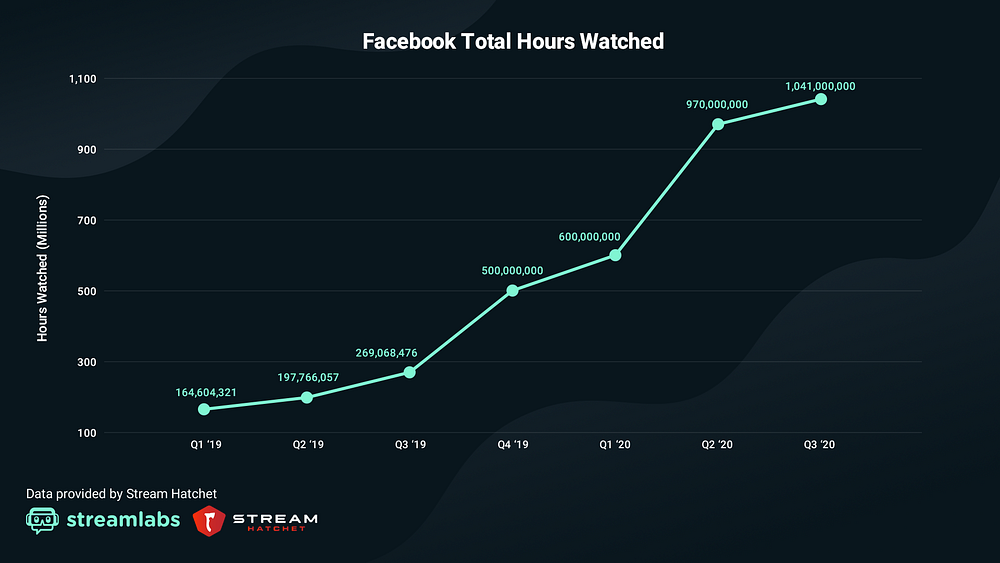
- Viewers watched 1.04 billion hours of content on Facebook Gaming in Q3, a 7.2% increase from 970 million hours In Q2.
- This is the first time Facebook Gaming has surpassed 1 billion hours watched in its history.
- Year-over-year, Facebook Gaming experienced a 297% increase from 269 million hours watched in Q3 2019.
- Facebook Gaming represents 14% of the market share for hours watched, a 1.4% increase from last quarter.
Total Hours Streamed
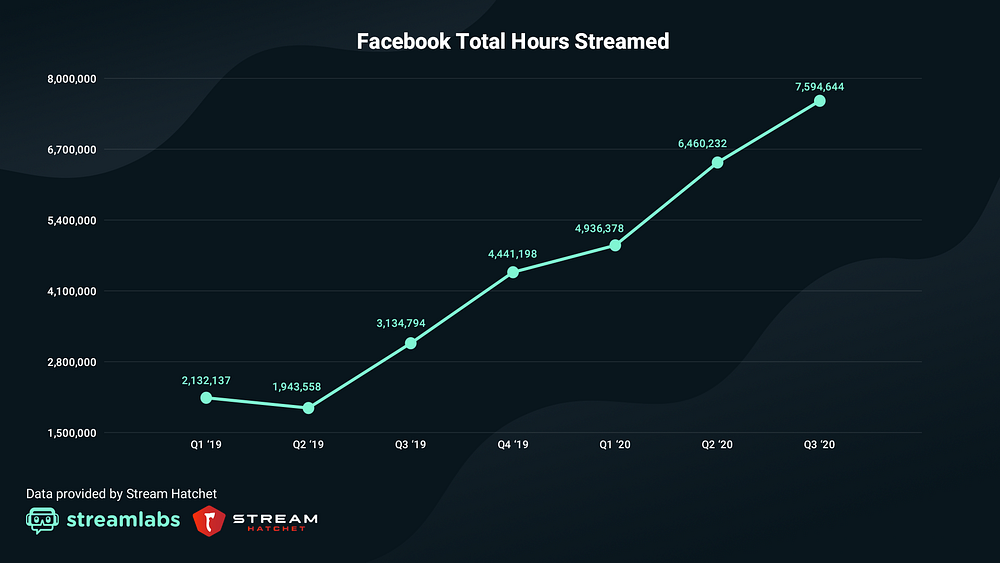
- Live streamers broadcasted 7.6 million hours of content on Facebook Gaming in Q3, a 17% increase from 6.5 million hours in Q2.
- Year-over-year, Facebook Gaming experienced a 143% increase from 3.14 million hours watched in Q3 2019.
- Facebook Gaming now represents 3.4% of the market share for hours streamed, a 1% increase from last quarter.
Unique Channels
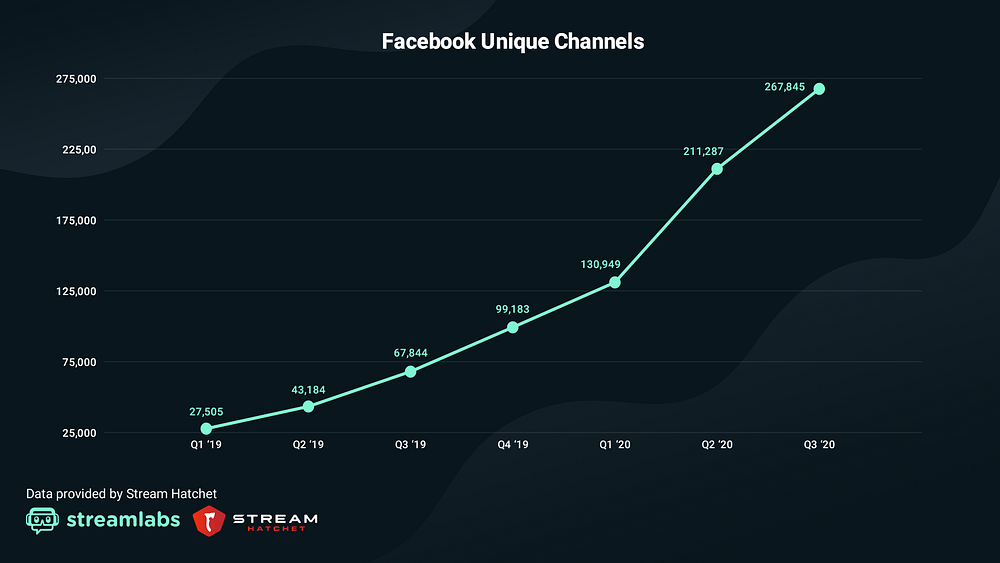
- 268,000 unique channels streamed to Facebook Gaming in Q3, increasing by 27% from 211,000 channels in Q2.
- Year-over-year, Facebook Gaming experienced a 294% increase from 68,000 channels in Q3 2019.
Average Concurrent Viewership
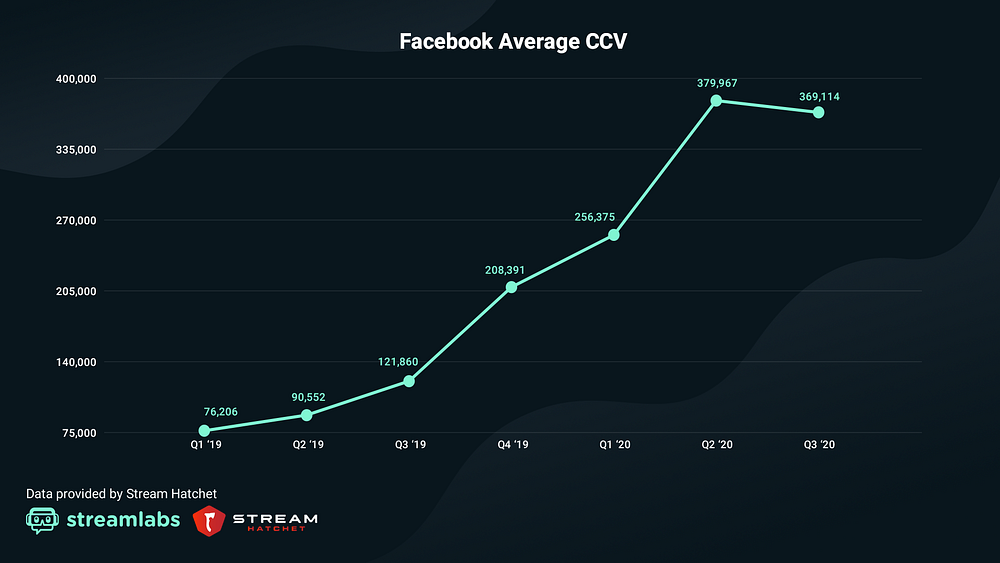
- The average concurrent viewership on Facebook Gaming reached 369,000 viewers, decreasing by 2.9% compared to Q2’s 380,000.
- Year-over-year, Facebook Gaming experienced a 202% increase in average concurrent viewership compared to 122,000 in Q3 2019.
Top Esports Watched in Q3 2020
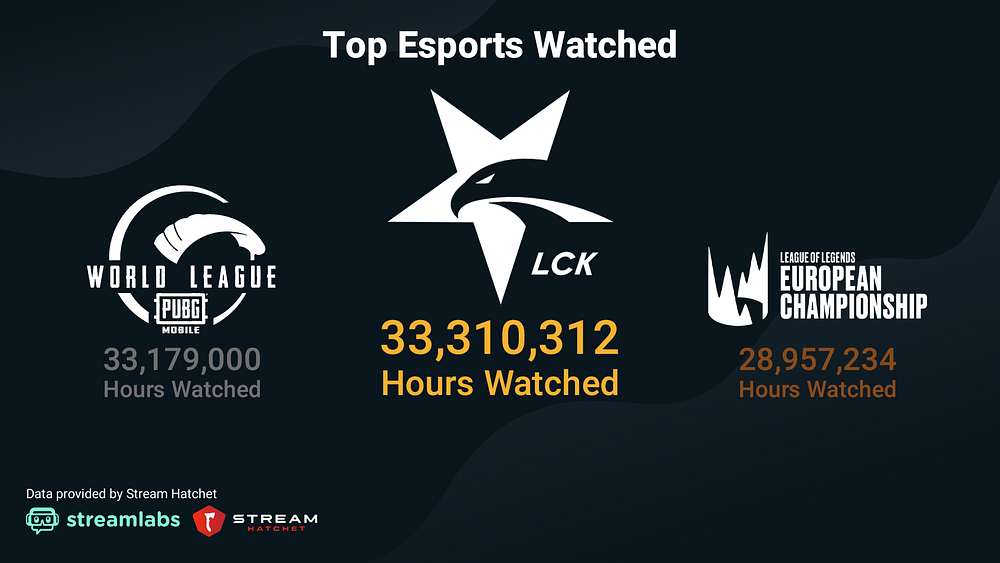
League of Legends — published by Riot Games — continues to lead as the most popular global esports title
Top Games Watched in Q3 2020
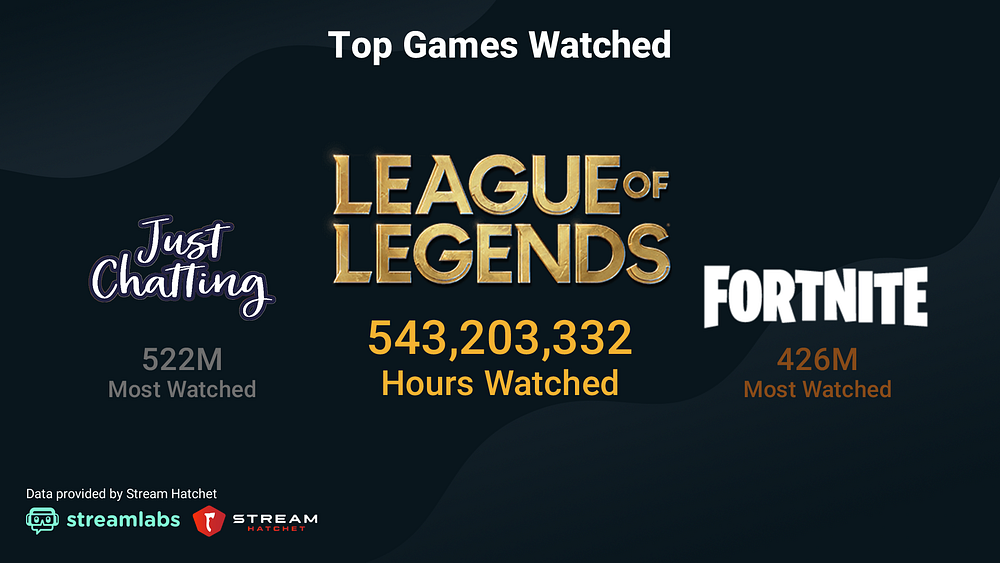
Just Chatting (although technically not a game) was the second most-watched category across all live stream platform. League of Legends reclaimed its top stop as the most-watched game after falling from the list last quarter due to the rise of Valorant.
Top Publishers Watched in Q3 2020

Download Streamlabs Desktop here.
Learn more about Stream Hatchet
If you have any questions or comments, please let us know. Remember to follow us on Twitter, Facebook, Instagram, and YouTube.